| Red | Green | Blue | |
| z | 17.64 | ||
| znorm | Inf | ||
| sky | -Inf | -Inf | -Inf |
| S/N | 21.9 | 37.0 | 41.8 |
| S/N(c) | 27.0 | 26.9 | 95.4 |
| SN(E/C) |
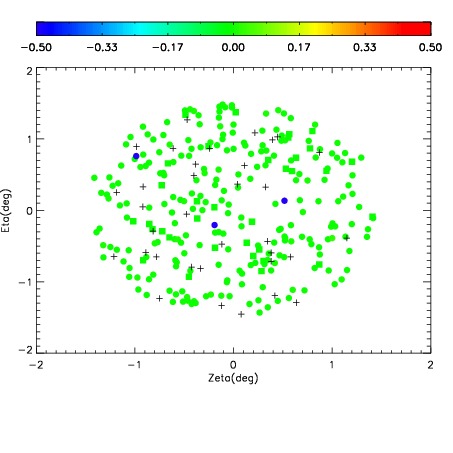
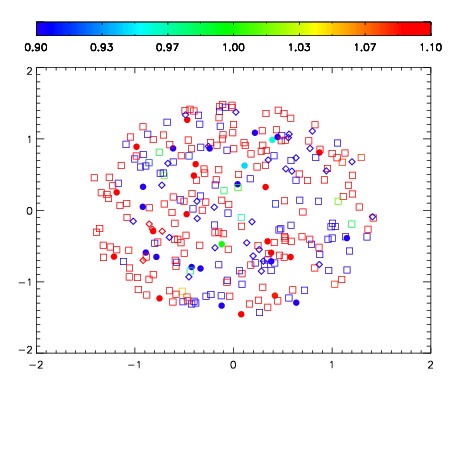
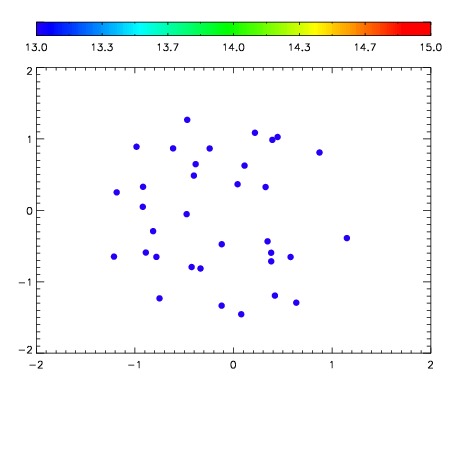

| Frame | Nreads | Zeropoints | Mag plots | Spatial mag deviation | Spatial sky 16325A emission deviations (filled: sky, open: star) | Spatial sky continuum emission | Spatial sky telluric CO2 absorption deviations (filled: H < 10) | |||||||||||||||||||||||
| 0 | 0 |
|
|
|
|
|
|
| IPAIR | NAME | SHIFT | NEWSHIFT | S/N | NAME | SHIFT | NEWSHIFT | S/N |
| 0 | 12720029 | 0.491101 | 0.00000 | 18.9164 | 12720030 | 1.96095e-05 | 0.491081 | 18.8269 |
| 1 | 12720028 | 0.490080 | 0.00102100 | 18.8570 | 12720023 | 0.00000 | 0.491101 | 18.7556 |
| 2 | 12720024 | 0.489616 | 0.00148499 | 18.8569 | 12720027 | -0.00215327 | 0.493254 | 18.7526 |
| 3 | 12720025 | 0.489322 | 0.00177899 | 18.7027 | 12720026 | -0.00206498 | 0.493166 | 18.6589 |