| Red | Green | Blue | |
| z | 17.64 | ||
| znorm | Inf | ||
| sky | -Inf | -Inf | -Inf |
| S/N | 30.9 | 51.0 | 55.3 |
| S/N(c) | 20.4 | 83.4 | 32.4 |
| SN(E/C) |
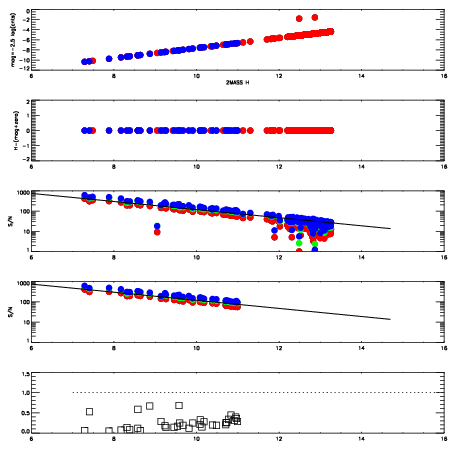
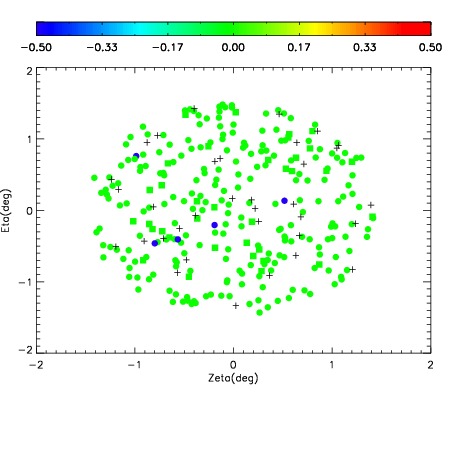

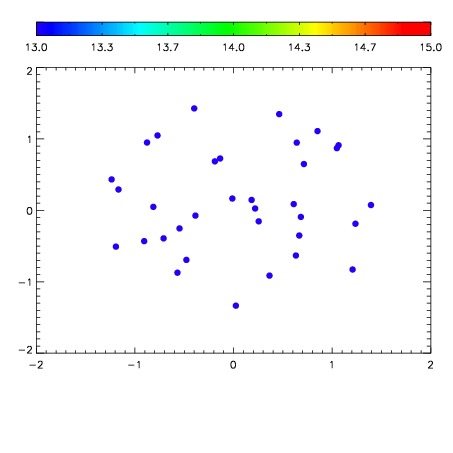

| Frame | Nreads | Zeropoints | Mag plots | Spatial mag deviation | Spatial sky 16325A emission deviations (filled: sky, open: star) | Spatial sky continuum emission | Spatial sky telluric CO2 absorption deviations (filled: H < 10) | |||||||||||||||||||||||
| 0 | 0 |
|
|
|
|
|
|
| IPAIR | NAME | SHIFT | NEWSHIFT | S/N | NAME | SHIFT | NEWSHIFT | S/N |
| 0 | 12580017 | 0.491166 | 0.00000 | 18.9838 | 12580014 | -0.00233171 | 0.493498 | 19.0717 |
| 1 | 12580012 | 0.489016 | 0.00215000 | 19.0645 | 12580015 | -0.00179502 | 0.492961 | 19.0904 |
| 2 | 12580013 | 0.489247 | 0.00191900 | 19.0641 | 12580018 | -0.00142250 | 0.492588 | 19.0904 |
| 3 | 12580016 | 0.490804 | 0.000362009 | 18.9482 | 12580011 | 0.00000 | 0.491166 | 19.0676 |