| Red | Green | Blue | |
| z | 17.64 | ||
| znorm | Inf | ||
| sky | -Inf | -Inf | -Inf |
| S/N | 29.4 | 50.2 | 53.5 |
| S/N(c) | 19.3 | 10.1 | 60.5 |
| SN(E/C) |


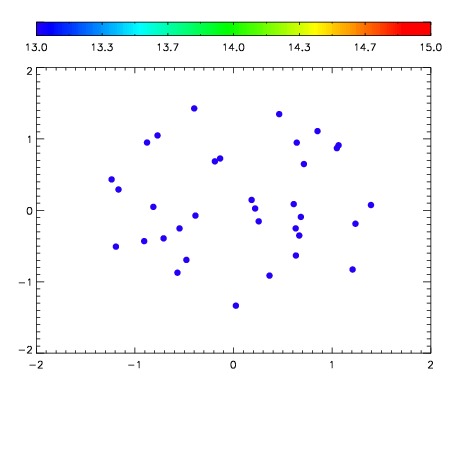

| Frame | Nreads | Zeropoints | Mag plots | Spatial mag deviation | Spatial sky 16325A emission deviations (filled: sky, open: star) | Spatial sky continuum emission | Spatial sky telluric CO2 absorption deviations (filled: H < 10) | |||||||||||||||||||||||
| 0 | 0 |
|
|
|
|
|
|
| IPAIR | NAME | SHIFT | NEWSHIFT | S/N | NAME | SHIFT | NEWSHIFT | S/N |
| 0 | 12660017 | 0.485868 | 0.00000 | 19.0549 | 12660018 | 0.00144390 | 0.484424 | 19.0713 |
| 1 | 12660012 | 0.483305 | 0.00256300 | 19.0339 | 12660011 | 0.00000 | 0.485868 | 19.0343 |
| 2 | 12660016 | 0.484532 | 0.00133601 | 19.0333 | 12660015 | -0.000232451 | 0.486100 | 18.9813 |
| 3 | 12660013 | 0.483529 | 0.00233901 | 19.0206 | 12660014 | -0.000827244 | 0.486695 | 18.9325 |