| Red | Green | Blue | |
| z | 17.64 | ||
| znorm | Inf | ||
| sky | -Inf | -Inf | -Inf |
| S/N | 24.1 | 43.0 | 46.0 |
| S/N(c) | 0.0 | 0.0 | 0.0 |
| SN(E/C) |


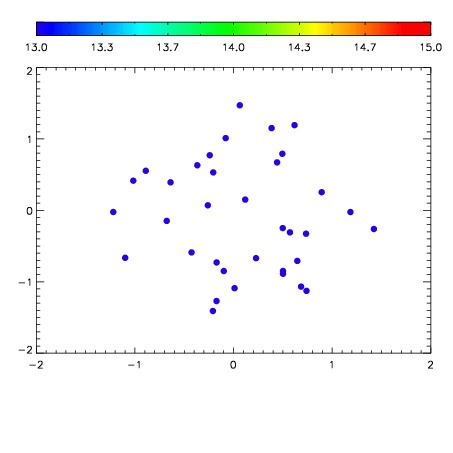

| Frame | Nreads | Zeropoints | Mag plots | Spatial mag deviation | Spatial sky 16325A emission deviations (filled: sky, open: star) | Spatial sky continuum emission | Spatial sky telluric CO2 absorption deviations (filled: H < 10) | |||||||||||||||||||||||
| 0 | 0 |
|
|
|
|
|
|
| IPAIR | NAME | SHIFT | NEWSHIFT | S/N | NAME | SHIFT | NEWSHIFT | S/N |
| 0 | 11940061 | 0.495648 | 0.00000 | 19.0170 | 11940063 | -0.00338391 | 0.499032 | 19.1024 |
| 1 | 11940065 | 0.495409 | 0.000238985 | 19.1392 | 11940066 | -0.00161475 | 0.497263 | 19.1376 |
| 2 | 11940064 | 0.495204 | 0.000443995 | 19.1193 | 11940062 | -0.00370942 | 0.499357 | 19.1032 |
| 3 | 11940060 | 0.495364 | 0.000283986 | 18.9242 | 11940059 | 0.00000 | 0.495648 | 18.9254 |