| Red | Green | Blue | |
| z | 17.64 | ||
| znorm | Inf | ||
| sky | -Inf | -Inf | -Inf |
| S/N | 16.5 | 29.1 | 32.8 |
| S/N(c) | 0.0 | 0.0 | 0.0 |
| SN(E/C) |
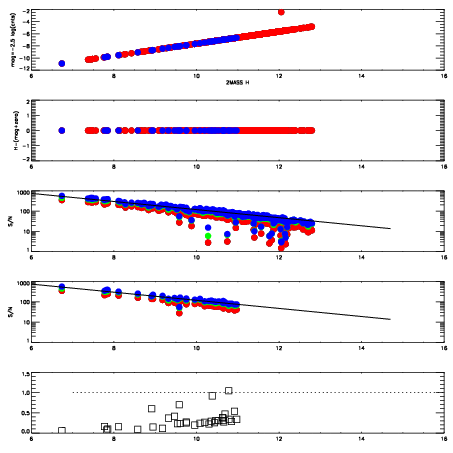
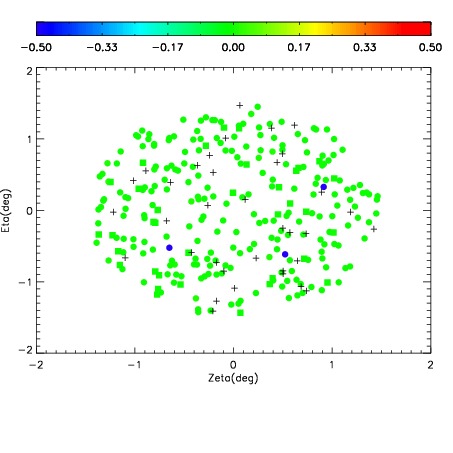
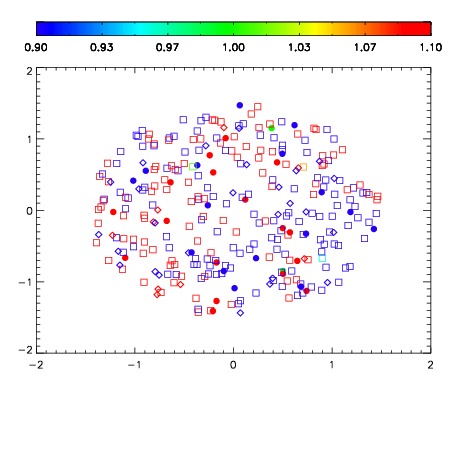
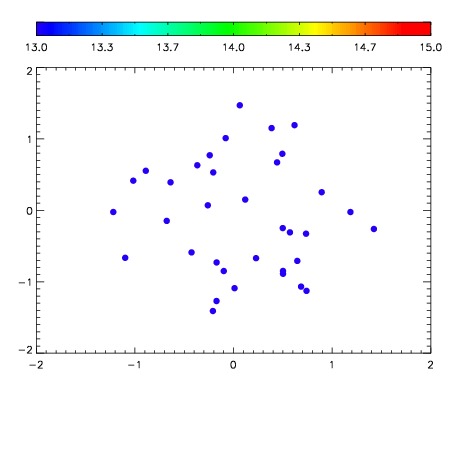

| Frame | Nreads | Zeropoints | Mag plots | Spatial mag deviation | Spatial sky 16325A emission deviations (filled: sky, open: star) | Spatial sky continuum emission | Spatial sky telluric CO2 absorption deviations (filled: H < 10) | |||||||||||||||||||||||
| 0 | 0 |
|
|
|
|
|
|
| IPAIR | NAME | SHIFT | NEWSHIFT | S/N | NAME | SHIFT | NEWSHIFT | S/N |
| 0 | 11990041 | 0.508809 | 0.00000 | 18.3007 | 11990039 | 0.00212969 | 0.506679 | 18.4222 |
| 1 | 11990037 | 0.505110 | 0.00369895 | 18.8317 | 11990035 | 0.00000 | 0.508809 | 18.7741 |
| 2 | 11990036 | 0.505188 | 0.00362098 | 18.7331 | 11990038 | 0.00222587 | 0.506583 | 18.5530 |
| 3 | 11990040 | 0.508641 | 0.000167966 | 18.5643 | 11990042 | 0.00137484 | 0.507434 | 18.4699 |