| Red | Green | Blue | |
| z | 17.64 | ||
| znorm | Inf | ||
| sky | -Inf | -Inf | -Inf |
| S/N | 22.7 | 39.6 | 42.1 |
| S/N(c) | 0.0 | 0.0 | 0.0 |
| SN(E/C) |
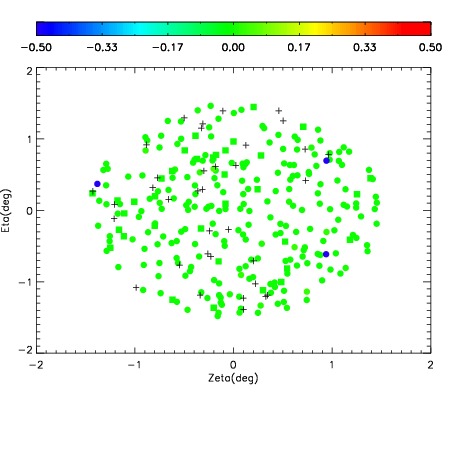
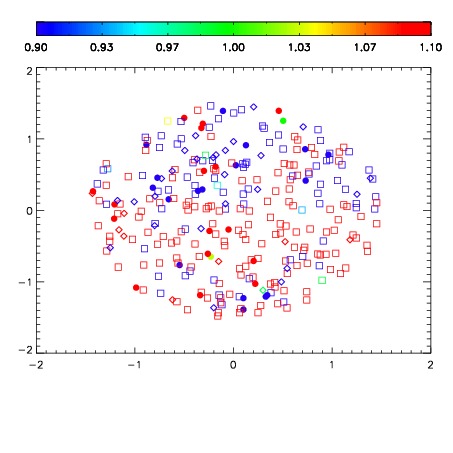


| Frame | Nreads | Zeropoints | Mag plots | Spatial mag deviation | Spatial sky 16325A emission deviations (filled: sky, open: star) | Spatial sky continuum emission | Spatial sky telluric CO2 absorption deviations (filled: H < 10) | |||||||||||||||||||||||
| 0 | 0 |
|
|
|
|
|
|
| IPAIR | NAME | SHIFT | NEWSHIFT | S/N | NAME | SHIFT | NEWSHIFT | S/N |
| 0 | 11440062 | 0.481544 | 0.00000 | 18.5728 | 11440064 | -0.000609955 | 0.482154 | 18.8449 |
| 1 | 11440058 | 0.480038 | 0.00150600 | 18.9846 | 11440060 | 0.000431225 | 0.481113 | 19.0203 |
| 2 | 11440063 | 0.481123 | 0.000420988 | 18.8394 | 11440057 | 0.00000 | 0.481544 | 18.9846 |
| 3 | 11440059 | 0.480974 | 0.000569999 | 18.7526 | 11440061 | 0.000868040 | 0.480676 | 18.9507 |