| Red | Green | Blue | |
| z | 17.64 | ||
| znorm | Inf | ||
| sky | -Inf | -NaN | -NaN |
| S/N | 21.8 | 39.1 | 41.0 |
| S/N(c) | 0.0 | 0.0 | 0.0 |
| SN(E/C) |
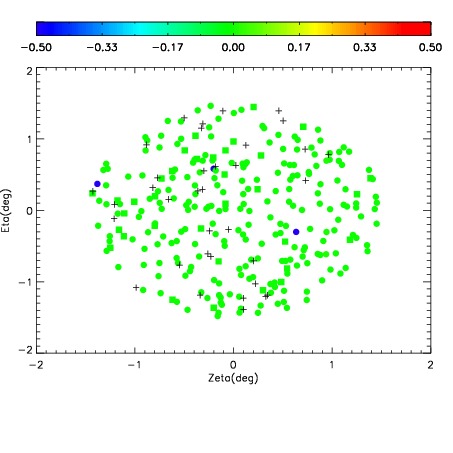
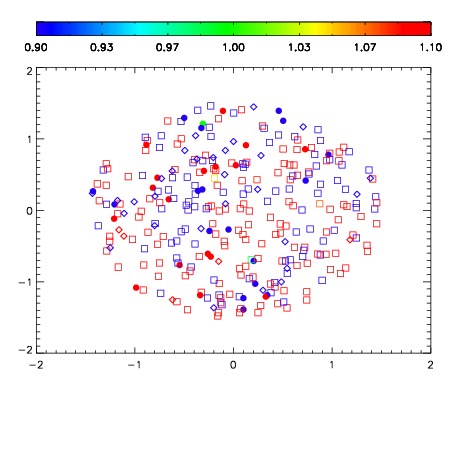
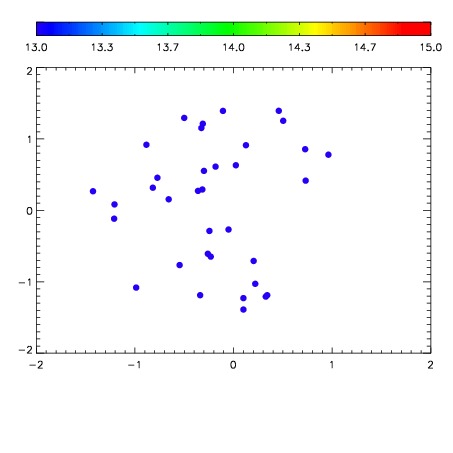

| Frame | Nreads | Zeropoints | Mag plots | Spatial mag deviation | Spatial sky 16325A emission deviations (filled: sky, open: star) | Spatial sky continuum emission | Spatial sky telluric CO2 absorption deviations (filled: H < 10) | |||||||||||||||||||||||
| 0 | 0 |
|
|
|
|
|
|
| IPAIR | NAME | SHIFT | NEWSHIFT | S/N | NAME | SHIFT | NEWSHIFT | S/N |
| 0 | 11720068 | 0.490430 | 0.00000 | 18.8069 | 11720069 | -0.00259274 | 0.493023 | 18.7871 |
| 1 | 11720067 | 0.489006 | 0.00142398 | 18.9493 | 11720066 | 0.00000 | 0.490430 | 18.8882 |
| 2 | 11720071 | 0.488990 | 0.00143999 | 18.5221 | 11720070 | -0.00275934 | 0.493189 | 18.6878 |
| 3 | 11720072 | 0.489450 | 0.000979990 | 18.4678 | 11720073 | -0.00320983 | 0.493640 | 18.6350 |