| Red | Green | Blue | |
| z | 17.64 | ||
| znorm | Inf | ||
| sky | -Inf | -Inf | -NaN |
| S/N | 27.5 | 46.8 | 49.9 |
| S/N(c) | 0.0 | 0.0 | 0.0 |
| SN(E/C) |
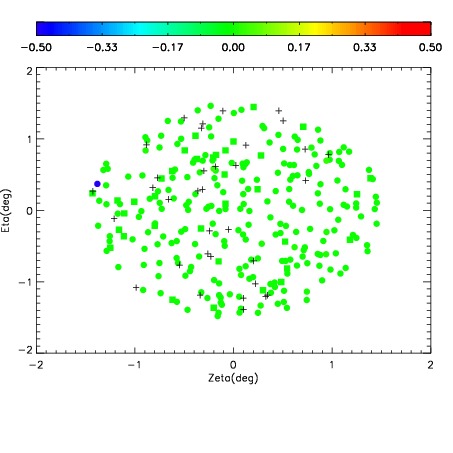
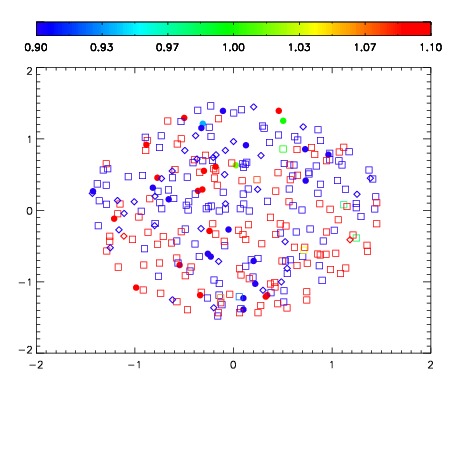
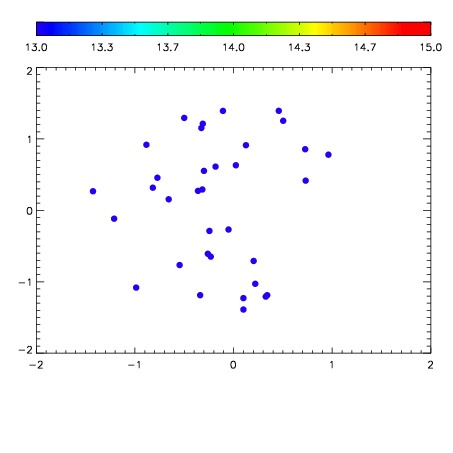

| Frame | Nreads | Zeropoints | Mag plots | Spatial mag deviation | Spatial sky 16325A emission deviations (filled: sky, open: star) | Spatial sky continuum emission | Spatial sky telluric CO2 absorption deviations (filled: H < 10) | |||||||||||||||||||||||
| 0 | 0 |
|
|
|
|
|
|
| IPAIR | NAME | SHIFT | NEWSHIFT | S/N | NAME | SHIFT | NEWSHIFT | S/N |
| 0 | 11940050 | 0.496577 | 0.00000 | 19.0830 | 11940055 | -9.10314e-05 | 0.496668 | 18.9715 |
| 1 | 11940053 | 0.494708 | 0.00186899 | 19.1208 | 11940051 | -0.000126849 | 0.496704 | 19.1079 |
| 2 | 11940049 | 0.496555 | 2.19941e-05 | 19.1108 | 11940048 | 0.00000 | 0.496577 | 19.0906 |
| 3 | 11940054 | 0.495195 | 0.00138199 | 19.0890 | 11940052 | 0.000198463 | 0.496379 | 19.0661 |