| Red | Green | Blue | |
| z | 17.64 | ||
| znorm | Inf | ||
| sky | -Inf | -NaN | -Inf |
| S/N | 21.3 | 36.3 | 38.9 |
| S/N(c) | 0.0 | 0.0 | 0.0 |
| SN(E/C) |
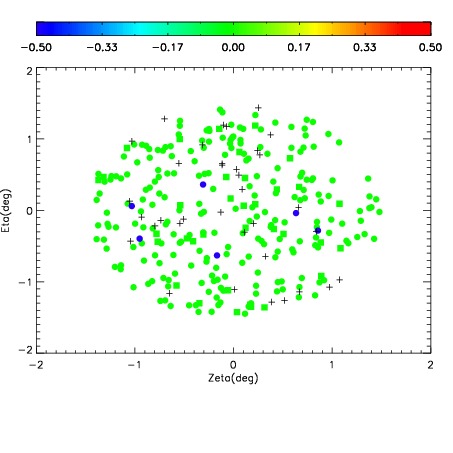
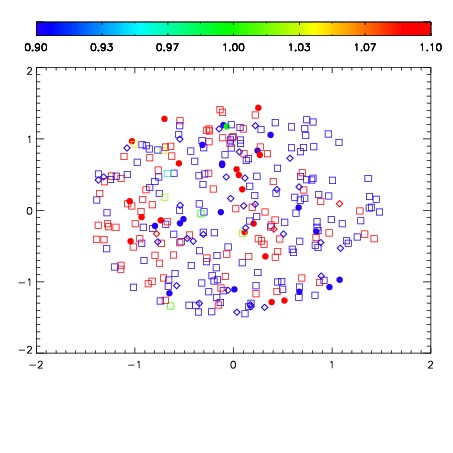
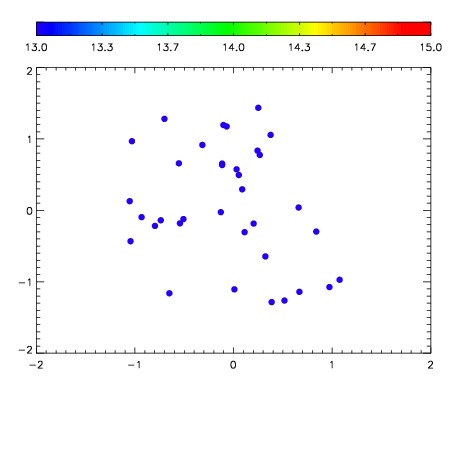

| Frame | Nreads | Zeropoints | Mag plots | Spatial mag deviation | Spatial sky 16325A emission deviations (filled: sky, open: star) | Spatial sky continuum emission | Spatial sky telluric CO2 absorption deviations (filled: H < 10) | |||||||||||||||||||||||
| 0 | 0 |
|
|
|
|
|
|
| IPAIR | NAME | SHIFT | NEWSHIFT | S/N | NAME | SHIFT | NEWSHIFT | S/N |
| 0 | 11360076 | 0.478716 | 0.00000 | 18.7910 | 11360077 | -0.00321072 | 0.481927 | 18.8426 |
| 1 | 11360080 | 0.478640 | 7.59959e-05 | 18.9627 | 11360081 | -0.00259547 | 0.481311 | 19.0481 |
| 2 | 11360079 | 0.477406 | 0.00130999 | 18.8637 | 11360078 | -0.00294034 | 0.481656 | 18.8753 |
| 3 | 11360075 | 0.477998 | 0.000717998 | 18.5536 | 11360074 | 0.00000 | 0.478716 | 16.9936 |