| Red | Green | Blue | |
| z | 17.64 | ||
| znorm | Inf | ||
| sky | -NaN | -Inf | -NaN |
| S/N | 23.1 | 41.0 | 42.5 |
| S/N(c) | 0.0 | 0.0 | 0.0 |
| SN(E/C) |
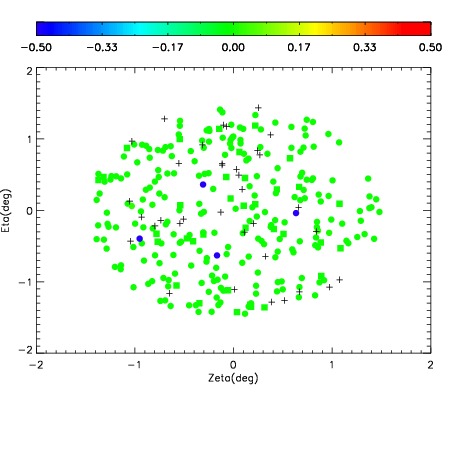
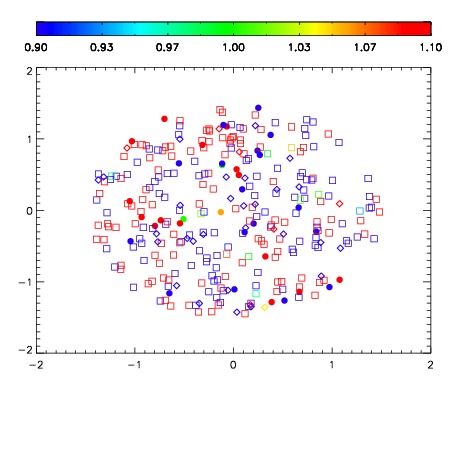


| Frame | Nreads | Zeropoints | Mag plots | Spatial mag deviation | Spatial sky 16325A emission deviations (filled: sky, open: star) | Spatial sky continuum emission | Spatial sky telluric CO2 absorption deviations (filled: H < 10) | |||||||||||||||||||||||
| 0 | 0 |
|
|
|
|
|
|
| IPAIR | NAME | SHIFT | NEWSHIFT | S/N | NAME | SHIFT | NEWSHIFT | S/N |
| 0 | 11430041 | 0.481540 | 0.00000 | 18.9776 | 11430039 | 0.00000 | 0.481540 | 18.9453 |
| 1 | 11430040 | 0.481429 | 0.000110984 | 19.0365 | 11430042 | -0.00167689 | 0.483217 | 19.0097 |
| 2 | 11430044 | 0.480994 | 0.000546008 | 18.9947 | 11430043 | -0.000644453 | 0.482184 | 18.9985 |
| 3 | 11430045 | 0.481172 | 0.000367999 | 18.9723 | 11430046 | -0.00245481 | 0.483995 | 18.2115 |