| Red | Green | Blue | |
| z | 17.64 | ||
| znorm | Inf | ||
| sky | -Inf | -Inf | -Inf |
| S/N | 24.1 | 40.9 | 43.6 |
| S/N(c) | 0.0 | 0.0 | 0.0 |
| SN(E/C) |
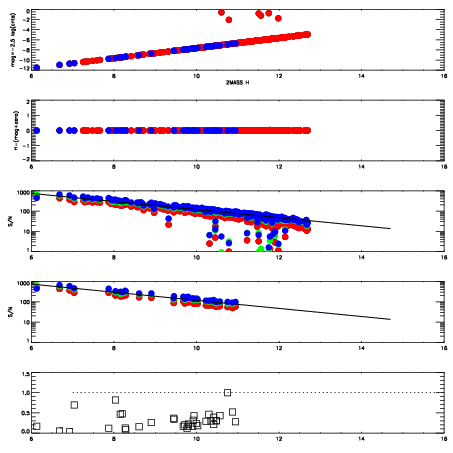
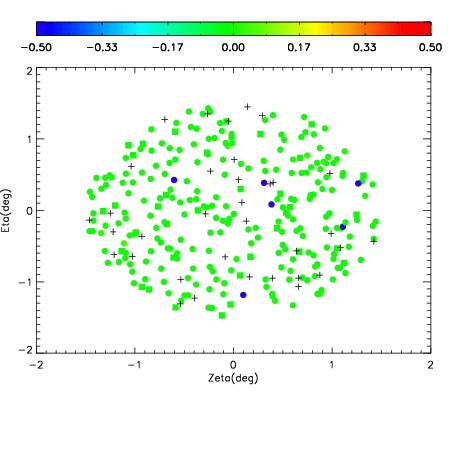
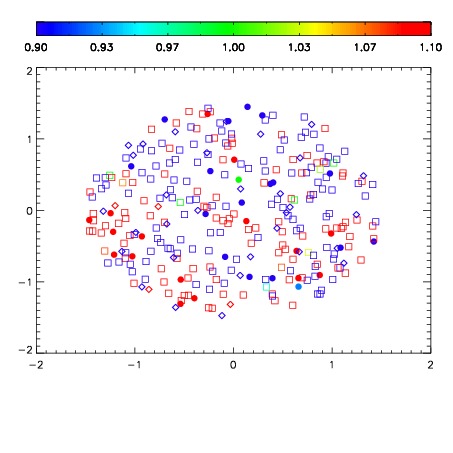


| Frame | Nreads | Zeropoints | Mag plots | Spatial mag deviation | Spatial sky 16325A emission deviations (filled: sky, open: star) | Spatial sky continuum emission | Spatial sky telluric CO2 absorption deviations (filled: H < 10) | |||||||||||||||||||||||
| 0 | 0 |
|
|
|
|
|
|
| IPAIR | NAME | SHIFT | NEWSHIFT | S/N | NAME | SHIFT | NEWSHIFT | S/N |
| 0 | 11430029 | 0.482151 | 0.00000 | 18.7698 | 11430031 | -0.00118785 | 0.483339 | 18.7601 |
| 1 | 11430033 | 0.480780 | 0.00137100 | 18.8789 | 11430035 | -0.00232863 | 0.484480 | 18.8695 |
| 2 | 11430034 | 0.481221 | 0.000930011 | 18.8231 | 11430032 | -0.000202730 | 0.482354 | 18.8386 |
| 3 | 11430030 | 0.482025 | 0.000126004 | 18.6730 | 11430028 | 0.00000 | 0.482151 | 18.6347 |