| Red | Green | Blue | |
| z | 17.64 | ||
| znorm | Inf | ||
| sky | -NaN | -Inf | -Inf |
| S/N | 26.9 | 44.4 | 48.1 |
| S/N(c) | 0.0 | 0.0 | 0.0 |
| SN(E/C) |
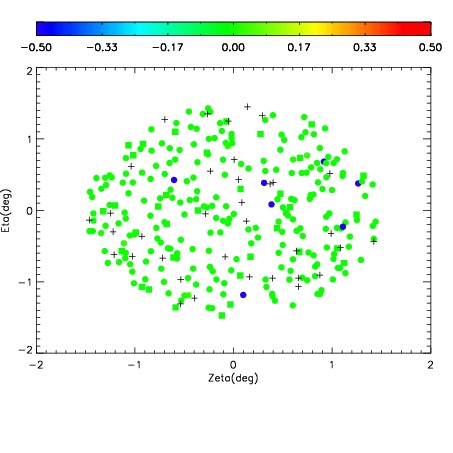
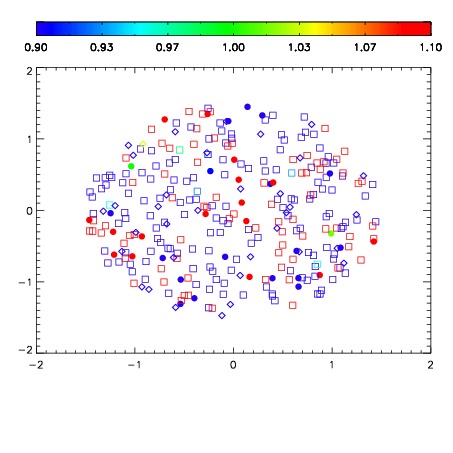
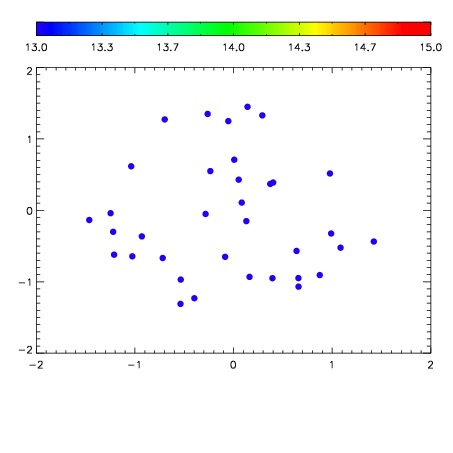

| Frame | Nreads | Zeropoints | Mag plots | Spatial mag deviation | Spatial sky 16325A emission deviations (filled: sky, open: star) | Spatial sky continuum emission | Spatial sky telluric CO2 absorption deviations (filled: H < 10) | |||||||||||||||||||||||
| 0 | 0 |
|
|
|
|
|
|
| IPAIR | NAME | SHIFT | NEWSHIFT | S/N | NAME | SHIFT | NEWSHIFT | S/N |
| 0 | 11710049 | 0.487126 | 0.00000 | 18.9598 | 11710052 | -0.00357657 | 0.490703 | 18.9511 |
| 1 | 11710053 | 0.486555 | 0.000570983 | 19.0229 | 11710055 | -0.00212234 | 0.489248 | 18.9937 |
| 2 | 11710054 | 0.486424 | 0.000701994 | 19.0204 | 11710051 | -0.00333400 | 0.490460 | 18.9740 |
| 3 | 11710050 | 0.486830 | 0.000295997 | 19.0028 | 11710048 | 0.00000 | 0.487126 | 18.9562 |