| Red | Green | Blue | |
| z | 17.64 | ||
| znorm | Inf | ||
| sky | -NaN | -NaN | -Inf |
| S/N | 12.3 | 23.1 | 24.6 |
| S/N(c) | 0.0 | 0.0 | 0.0 |
| SN(E/C) |


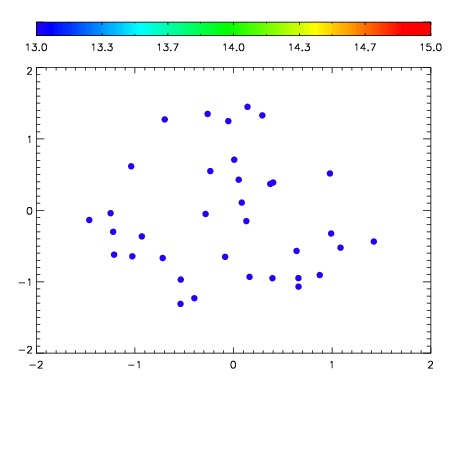

| Frame | Nreads | Zeropoints | Mag plots | Spatial mag deviation | Spatial sky 16325A emission deviations (filled: sky, open: star) | Spatial sky continuum emission | Spatial sky telluric CO2 absorption deviations (filled: H < 10) | |||||||||||||||||||||||
| 0 | 0 |
|
|
|
|
|
|
| IPAIR | NAME | SHIFT | NEWSHIFT | S/N | NAME | SHIFT | NEWSHIFT | S/N |
| 0 | 11760012 | 0.492348 | 0.00000 | 17.7736 | 11760013 | -0.00395638 | 0.496304 | 17.7772 |
| 1 | 11760015 | 0.491092 | 0.00125599 | 18.0377 | 11760010 | 0.00000 | 0.492348 | 18.2244 |
| 2 | 11760016 | 0.491922 | 0.000425994 | 17.8761 | 11760017 | -0.00438103 | 0.496729 | 18.0744 |
| 3 | 11760011 | 0.492072 | 0.000275999 | 17.4788 | 11760014 | -0.00361487 | 0.495963 | 17.7185 |