| Red | Green | Blue | |
| z | 17.64 | ||
| znorm | Inf | ||
| sky | -NaN | -NaN | -Inf |
| S/N | 19.5 | 35.4 | 37.9 |
| S/N(c) | 0.0 | 0.0 | 0.0 |
| SN(E/C) |
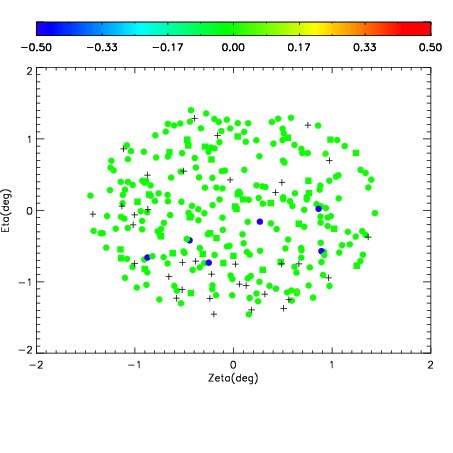
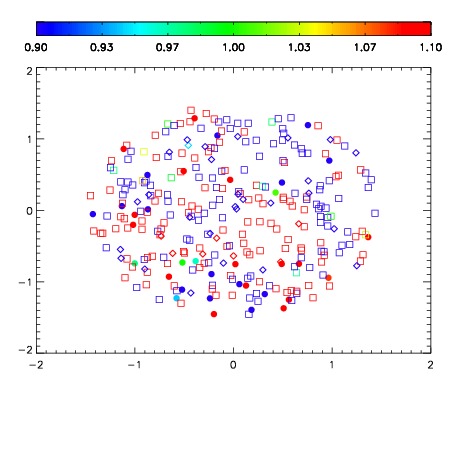
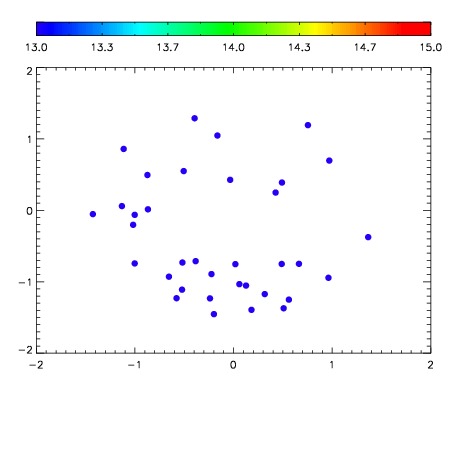

| Frame | Nreads | Zeropoints | Mag plots | Spatial mag deviation | Spatial sky 16325A emission deviations (filled: sky, open: star) | Spatial sky continuum emission | Spatial sky telluric CO2 absorption deviations (filled: H < 10) | |||||||||||||||||||||||
| 0 | 0 |
|
|
|
|
|
|
| IPAIR | NAME | SHIFT | NEWSHIFT | S/N | NAME | SHIFT | NEWSHIFT | S/N |
| 0 | 11360065 | 0.481014 | 0.00000 | 18.1441 | 11360066 | -0.000510071 | 0.481524 | 17.7549 |
| 1 | 11360061 | 0.480546 | 0.000468016 | 18.7568 | 11360059 | 0.00000 | 0.481014 | 18.8295 |
| 2 | 11360064 | 0.479986 | 0.00102800 | 18.6827 | 11360063 | -0.000907287 | 0.481921 | 18.7597 |
| 3 | 11360060 | 0.479819 | 0.00119501 | 18.6202 | 11360062 | -0.000653810 | 0.481668 | 18.5168 |
| 4 | 11360068 | 0.479684 | 0.00133002 | 17.8513 | 11360067 | -0.000851579 | 0.481866 | 17.6325 |
| 5 | 11360069 | 0.480858 | 0.000156015 | 17.6793 | 11360070 | -0.000903478 | 0.481918 | 17.5103 |