| Red | Green | Blue | |
| z | 17.64 | ||
| znorm | Inf | ||
| sky | -Inf | -NaN | -Inf |
| S/N | 25.3 | 42.5 | 45.8 |
| S/N(c) | 0.0 | 0.0 | 0.0 |
| SN(E/C) |
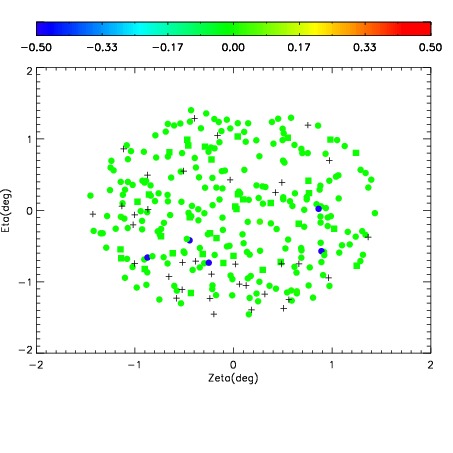
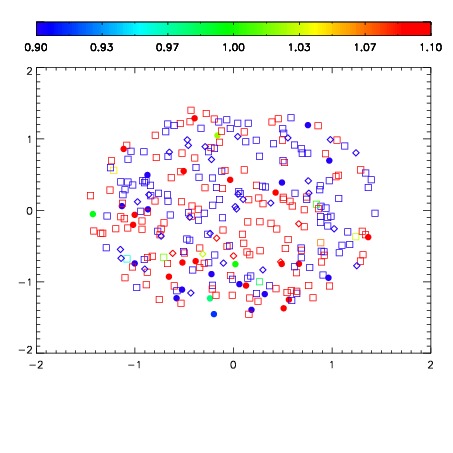
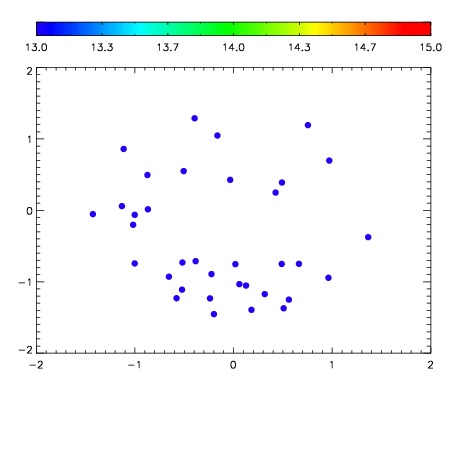

| Frame | Nreads | Zeropoints | Mag plots | Spatial mag deviation | Spatial sky 16325A emission deviations (filled: sky, open: star) | Spatial sky continuum emission | Spatial sky telluric CO2 absorption deviations (filled: H < 10) | |||||||||||||||||||||||
| 0 | 0 |
|
|
|
|
|
|
| IPAIR | NAME | SHIFT | NEWSHIFT | S/N | NAME | SHIFT | NEWSHIFT | S/N |
| 0 | 11380065 | 0.473913 | 0.00000 | 18.9788 | 11380066 | 0.000258405 | 0.473655 | 18.9795 |
| 1 | 11380064 | 0.473577 | 0.000336021 | 19.0149 | 11380063 | -0.00210586 | 0.476019 | 19.0271 |
| 2 | 11380060 | 0.472934 | 0.000979006 | 19.0114 | 11380062 | -0.00208715 | 0.476000 | 19.0023 |
| 3 | 11380061 | 0.472953 | 0.000960022 | 18.9636 | 11380059 | 0.00000 | 0.473913 | 18.9726 |