| Red | Green | Blue | |
| z | 17.64 | ||
| znorm | Inf | ||
| sky | -Inf | -Inf | -Inf |
| S/N | 25.3 | 44.6 | 47.2 |
| S/N(c) | 0.0 | 0.0 | 0.0 |
| SN(E/C) |
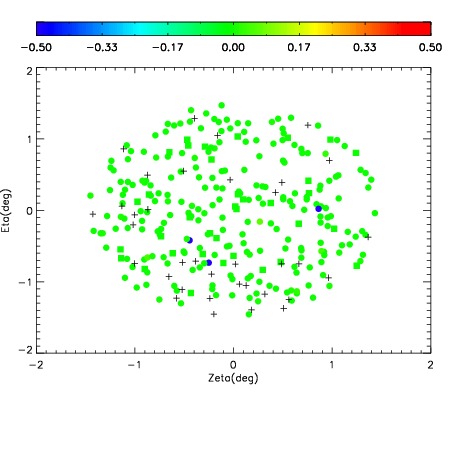
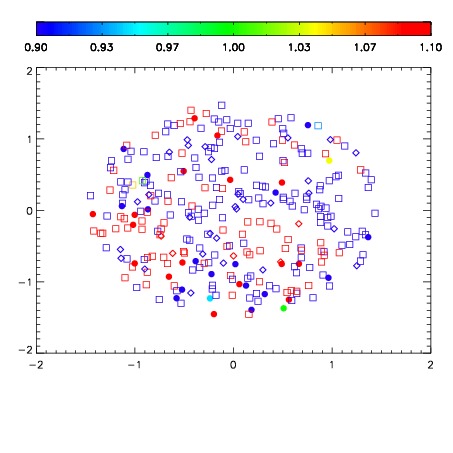
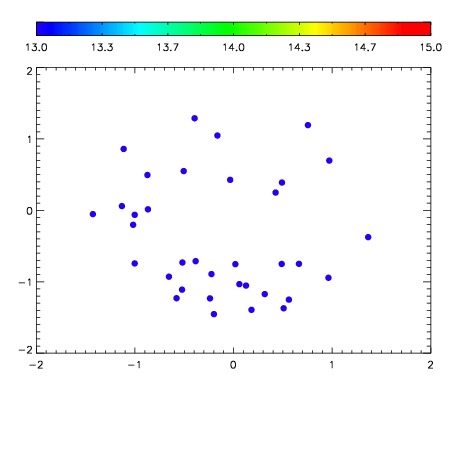

| Frame | Nreads | Zeropoints | Mag plots | Spatial mag deviation | Spatial sky 16325A emission deviations (filled: sky, open: star) | Spatial sky continuum emission | Spatial sky telluric CO2 absorption deviations (filled: H < 10) | |||||||||||||||||||||||
| 0 | 0 |
|
|
|
|
|
|
| IPAIR | NAME | SHIFT | NEWSHIFT | S/N | NAME | SHIFT | NEWSHIFT | S/N |
| 0 | 11670057 | 0.493527 | 0.00000 | 18.2857 | 11670051 | -0.00247734 | 0.496004 | 18.0390 |
| 1 | 11670048 | 0.491589 | 0.00193799 | 18.9944 | 11670055 | -0.00391348 | 0.497440 | 18.9475 |
| 2 | 11670049 | 0.492111 | 0.00141600 | 18.8031 | 11670047 | 0.00000 | 0.493527 | 18.9128 |
| 3 | 11670053 | 0.492395 | 0.00113198 | 18.6838 | 11670054 | -0.00312783 | 0.496655 | 18.7253 |
| 4 | 11670056 | 0.492023 | 0.00150400 | 18.6239 | 11670058 | -0.00258538 | 0.496112 | 18.4381 |
| 5 | 11670052 | 0.491437 | 0.00209001 | 18.5421 | 11670050 | -0.00383913 | 0.497366 | 18.4034 |