| Red | Green | Blue | |
| z | 17.64 | ||
| znorm | Inf | ||
| sky | -NaN | -NaN | -Inf |
| S/N | 22.6 | 39.3 | 41.9 |
| S/N(c) | 0.0 | 0.0 | 0.0 |
| SN(E/C) |
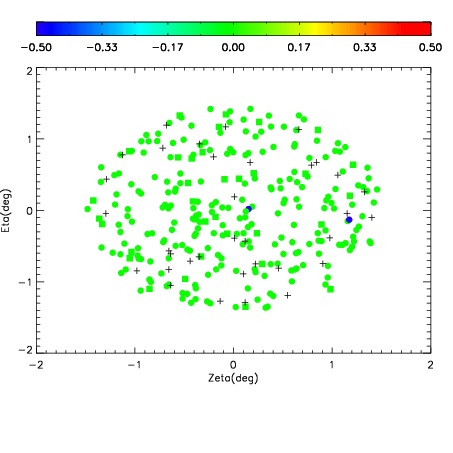
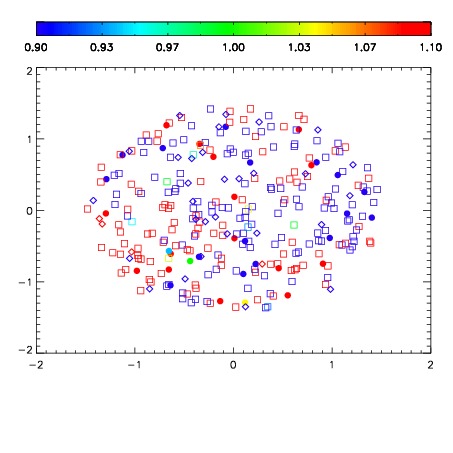
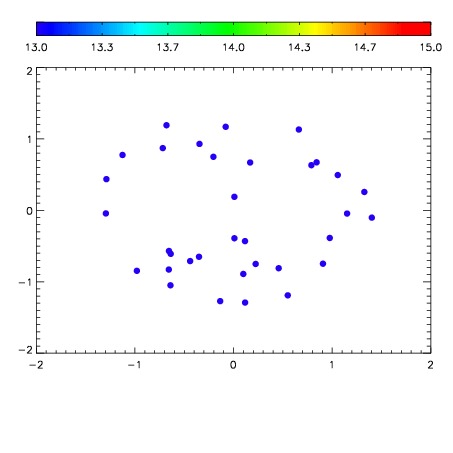

| Frame | Nreads | Zeropoints | Mag plots | Spatial mag deviation | Spatial sky 16325A emission deviations (filled: sky, open: star) | Spatial sky continuum emission | Spatial sky telluric CO2 absorption deviations (filled: H < 10) | |||||||||||||||||||||||
| 0 | 0 |
|
|
|
|
|
|
| IPAIR | NAME | SHIFT | NEWSHIFT | S/N | NAME | SHIFT | NEWSHIFT | S/N |
| 0 | 11400053 | 0.474834 | 0.00000 | 18.8315 | 11400052 | 0.00000 | 0.474834 | 18.7849 |
| 1 | 11400058 | 0.474638 | 0.000196010 | 18.8371 | 11400059 | 0.000448244 | 0.474386 | 18.8719 |
| 2 | 11400054 | 0.474542 | 0.000292003 | 18.8012 | 11400055 | -0.00112764 | 0.475962 | 18.7376 |
| 3 | 11400057 | 0.474360 | 0.000474006 | 18.7654 | 11400056 | -0.00188283 | 0.476717 | 18.7346 |