| Red | Green | Blue | |
| z | 17.63 | ||
| znorm | Inf | ||
| sky | -Inf | -NaN | -Inf |
| S/N | 28.7 | 48.8 | 51.2 |
| S/N(c) | 0.0 | 0.0 | 0.0 |
| SN(E/C) |
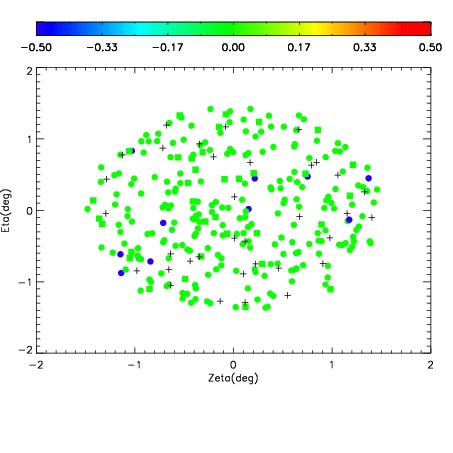
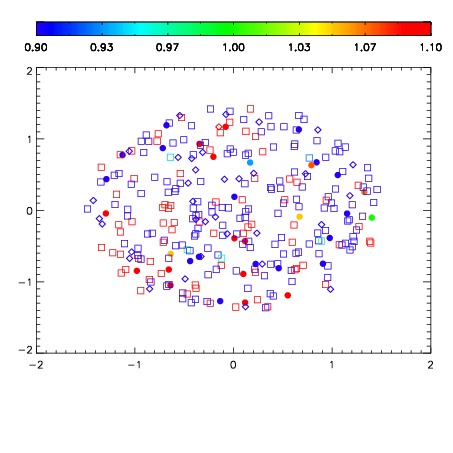


| Frame | Nreads | Zeropoints | Mag plots | Spatial mag deviation | Spatial sky 16325A emission deviations (filled: sky, open: star) | Spatial sky continuum emission | Spatial sky telluric CO2 absorption deviations (filled: H < 10) | |||||||||||||||||||||||
| 0 | 0 |
|
|
|
|
|
|
| IPAIR | NAME | SHIFT | NEWSHIFT | S/N | NAME | SHIFT | NEWSHIFT | S/N |
| 0 | 11470016 | 0.477112 | 0.00000 | 19.1130 | 11470015 | -0.00323170 | 0.480344 | 19.0899 |
| 1 | 11470017 | 0.476150 | 0.000961989 | 19.1371 | 11470018 | -0.00310139 | 0.480213 | 19.1532 |
| 2 | 11470013 | 0.475889 | 0.00122300 | 19.0674 | 11470014 | -0.00300808 | 0.480120 | 19.0640 |
| 3 | 11470012 | 0.476245 | 0.000867009 | 19.0400 | 11470011 | 0.00000 | 0.477112 | 18.9989 |