| Red | Green | Blue | |
| z | 17.64 | ||
| znorm | Inf | ||
| sky | -NaN | -NaN | -Inf |
| S/N | 18.7 | 33.7 | 36.0 |
| S/N(c) | 0.0 | 0.0 | 0.0 |
| SN(E/C) |
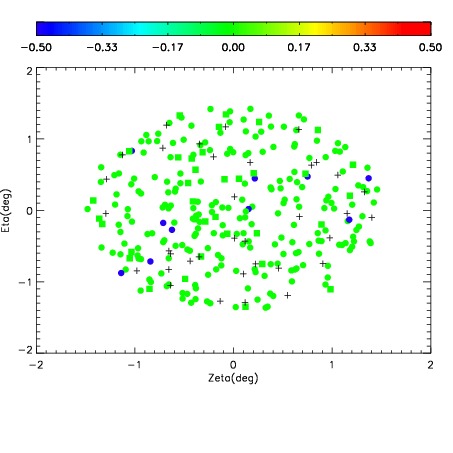
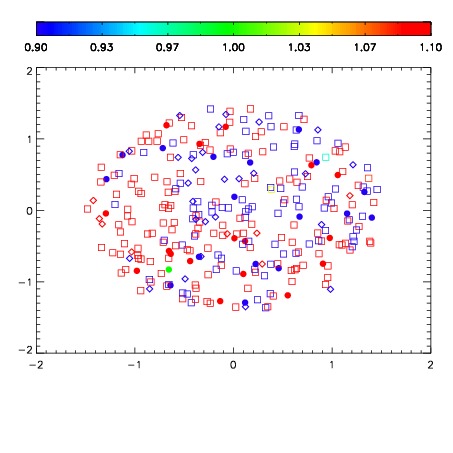
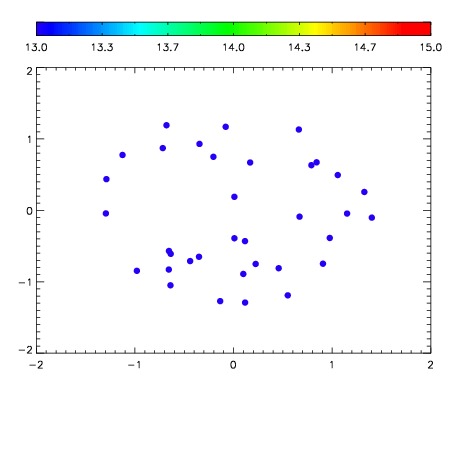

| Frame | Nreads | Zeropoints | Mag plots | Spatial mag deviation | Spatial sky 16325A emission deviations (filled: sky, open: star) | Spatial sky continuum emission | Spatial sky telluric CO2 absorption deviations (filled: H < 10) | |||||||||||||||||||||||
| 0 | 0 |
|
|
|
|
|
|
| IPAIR | NAME | SHIFT | NEWSHIFT | S/N | NAME | SHIFT | NEWSHIFT | S/N |
| 0 | 11730039 | 0.492171 | 0.00000 | 18.5178 | 11730036 | -0.000320966 | 0.492492 | 18.4607 |
| 1 | 11730038 | 0.491816 | 0.000354975 | 18.6196 | 11730040 | -0.00201179 | 0.494183 | 18.6336 |
| 2 | 11730035 | 0.492162 | 9.00030e-06 | 18.5670 | 11730037 | -0.000635183 | 0.492806 | 18.5823 |
| 3 | 11730034 | 0.492152 | 1.89841e-05 | 18.3496 | 11730033 | 0.00000 | 0.492171 | 18.4567 |