| Red | Green | Blue | |
| z | 17.64 | ||
| znorm | Inf | ||
| sky | -NaN | -NaN | -NaN |
| S/N | 22.1 | 38.2 | 40.5 |
| S/N(c) | 0.0 | 0.0 | 0.0 |
| SN(E/C) |
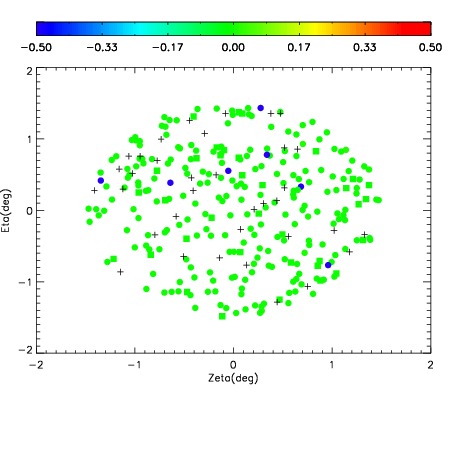
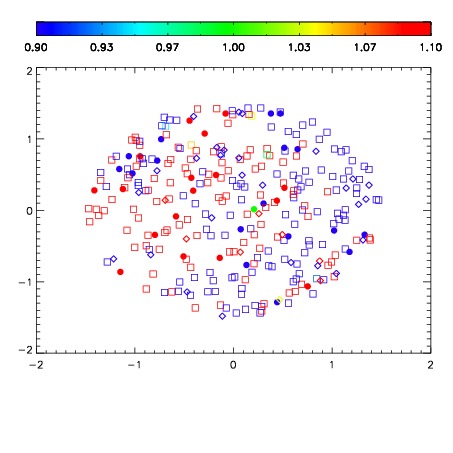
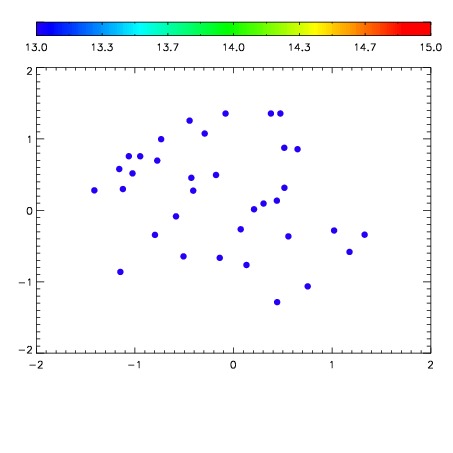

| Frame | Nreads | Zeropoints | Mag plots | Spatial mag deviation | Spatial sky 16325A emission deviations (filled: sky, open: star) | Spatial sky continuum emission | Spatial sky telluric CO2 absorption deviations (filled: H < 10) | |||||||||||||||||||||||
| 0 | 0 |
|
|
|
|
|
|
| IPAIR | NAME | SHIFT | NEWSHIFT | S/N | NAME | SHIFT | NEWSHIFT | S/N |
| 0 | 11160048 | 0.478300 | 0.00000 | 18.7284 | 11160046 | 0.00000 | 0.478300 | 18.7416 |
| 1 | 11160051 | 0.477987 | 0.000313014 | 18.8221 | 11160050 | -0.00188860 | 0.480189 | 18.8134 |
| 2 | 11160047 | 0.477377 | 0.000923008 | 18.8167 | 11160049 | -0.00245933 | 0.480759 | 18.7458 |
| 3 | 11160052 | 0.478198 | 0.000102013 | 18.7868 | 11160053 | 0.00194809 | 0.476352 | 18.7425 |