| Red | Green | Blue | |
| z | 17.64 | ||
| znorm | Inf | ||
| sky | -Inf | -Inf | -Inf |
| S/N | 17.1 | 30.7 | 32.6 |
| S/N(c) | 0.0 | 0.0 | 0.0 |
| SN(E/C) |
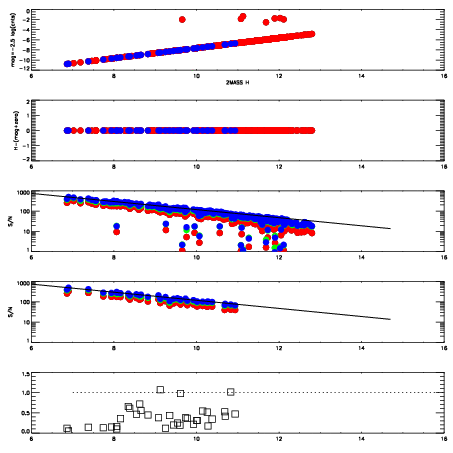
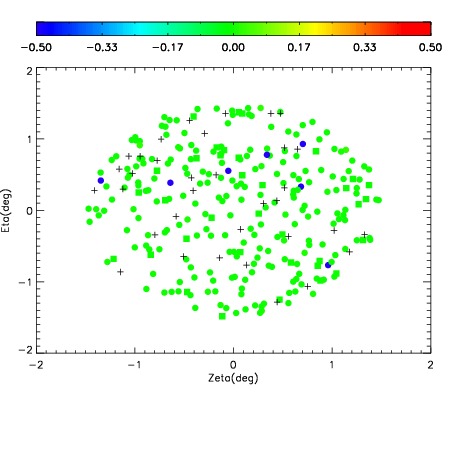
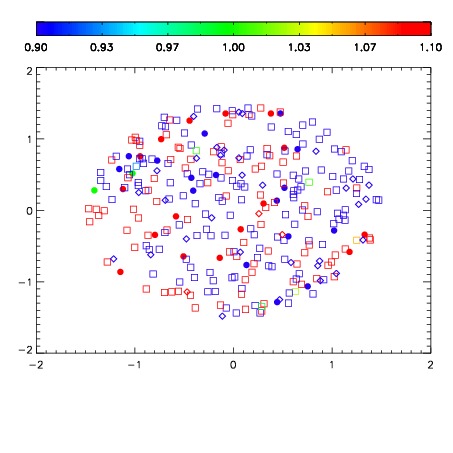
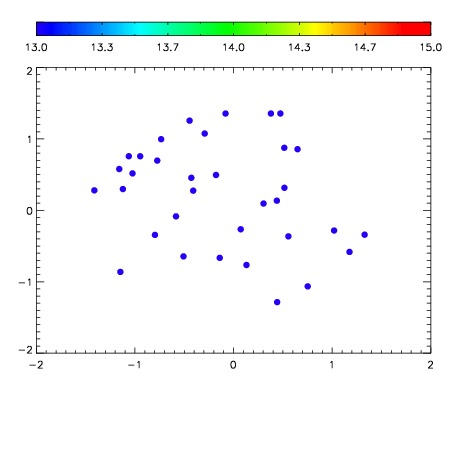

| Frame | Nreads | Zeropoints | Mag plots | Spatial mag deviation | Spatial sky 16325A emission deviations (filled: sky, open: star) | Spatial sky continuum emission | Spatial sky telluric CO2 absorption deviations (filled: H < 10) | |||||||||||||||||||||||
| 0 | 0 |
|
|
|
|
|
|
| IPAIR | NAME | SHIFT | NEWSHIFT | S/N | NAME | SHIFT | NEWSHIFT | S/N |
| 0 | 11340059 | 0.482840 | 0.00000 | 17.5819 | 11340054 | 0.00000 | 0.482840 | 17.4903 |
| 1 | 11340056 | 0.480402 | 0.00243801 | 18.8270 | 11340057 | -0.00185339 | 0.484693 | 18.5931 |
| 2 | 11340060 | 0.482109 | 0.000730991 | 18.8045 | 11340061 | -0.000173985 | 0.483014 | 18.4096 |
| 3 | 11340055 | 0.480184 | 0.00265601 | 18.6101 | 11340058 | -0.00113968 | 0.483980 | 17.8376 |