| Red | Green | Blue | |
| z | 17.64 | ||
| znorm | Inf | ||
| sky | -Inf | -Inf | -Inf |
| S/N | 28.5 | 50.4 | 54.1 |
| S/N(c) | 0.0 | 0.0 | 0.0 |
| SN(E/C) |
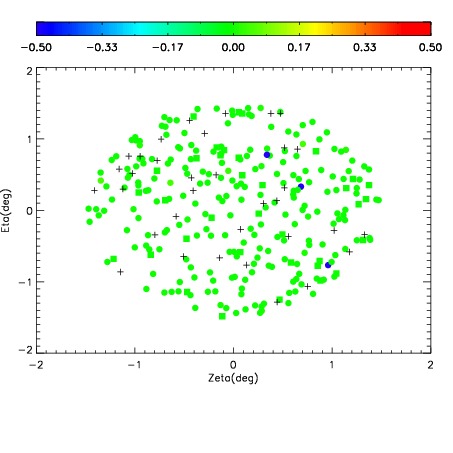
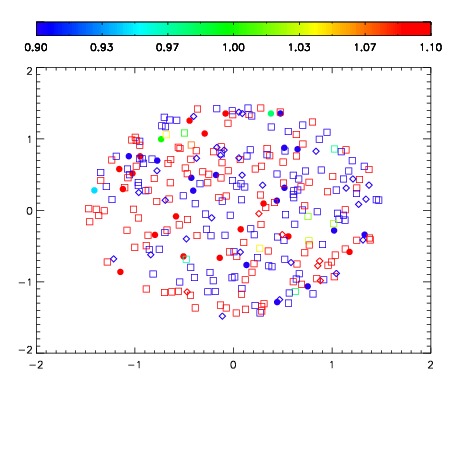
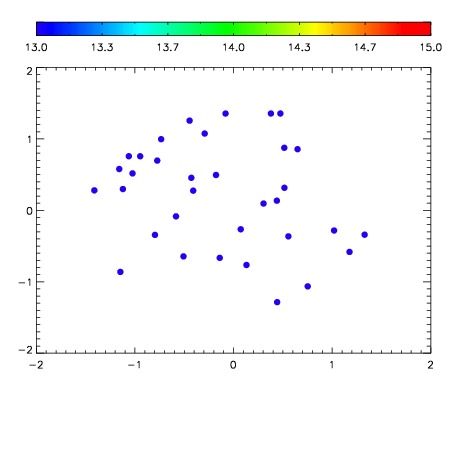

| Frame | Nreads | Zeropoints | Mag plots | Spatial mag deviation | Spatial sky 16325A emission deviations (filled: sky, open: star) | Spatial sky continuum emission | Spatial sky telluric CO2 absorption deviations (filled: H < 10) | |||||||||||||||||||||||
| 0 | 0 |
|
|
|
|
|
|
| IPAIR | NAME | SHIFT | NEWSHIFT | S/N | NAME | SHIFT | NEWSHIFT | S/N |
| 0 | 11350064 | 0.478539 | 0.00000 | 18.7595 | 11350065 | -0.00185865 | 0.480398 | 18.5862 |
| 1 | 11350056 | 0.477807 | 0.000732005 | 18.9584 | 11350054 | 0.00000 | 0.478539 | 18.9030 |
| 2 | 11350055 | 0.476714 | 0.00182500 | 18.9558 | 11350057 | -0.00237890 | 0.480918 | 18.8857 |
| 3 | 11350059 | 0.476668 | 0.00187099 | 18.8602 | 11350061 | -0.00151647 | 0.480055 | 18.8360 |
| 4 | 11350063 | 0.478203 | 0.000335991 | 18.8194 | 11350058 | -0.00234825 | 0.480887 | 18.7980 |
| 5 | 11350060 | 0.477496 | 0.00104299 | 18.7880 | 11350062 | -0.00164289 | 0.480182 | 18.7440 |