| Red | Green | Blue | |
| z | 17.64 | ||
| znorm | Inf | ||
| sky | -NaN | -Inf | -Inf |
| S/N | 29.1 | 49.8 | 55.6 |
| S/N(c) | 0.0 | 0.0 | 0.0 |
| SN(E/C) |
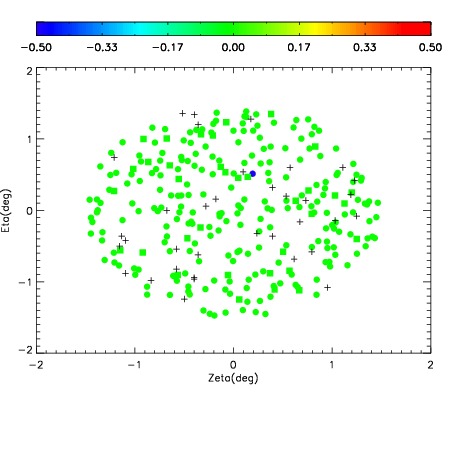
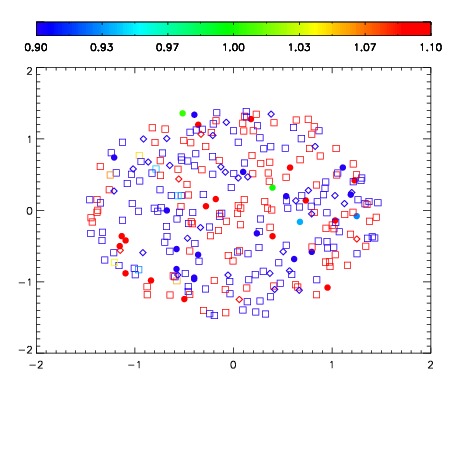
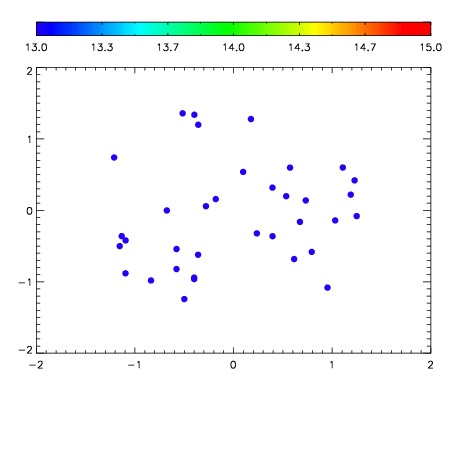

| Frame | Nreads | Zeropoints | Mag plots | Spatial mag deviation | Spatial sky 16325A emission deviations (filled: sky, open: star) | Spatial sky continuum emission | Spatial sky telluric CO2 absorption deviations (filled: H < 10) | |||||||||||||||||||||||
| 0 | 0 |
|
|
|
|
|
|
| IPAIR | NAME | SHIFT | NEWSHIFT | S/N | NAME | SHIFT | NEWSHIFT | S/N |
| 0 | 11120091 | 0.479924 | 0.00000 | 18.9845 | 11120092 | 0.000518465 | 0.479406 | 19.0146 |
| 1 | 11120087 | 0.478037 | 0.00188699 | 18.8789 | 11120085 | 0.000992580 | 0.478931 | 18.8169 |
| 2 | 11120090 | 0.479620 | 0.000303984 | 18.8669 | 11120089 | -0.00157859 | 0.481503 | 18.7873 |
| 3 | 11120086 | 0.477712 | 0.00221199 | 18.8605 | 11120084 | -0.00108194 | 0.481006 | 18.7204 |
| 4 | 11120083 | 0.476778 | 0.00314599 | 18.7913 | 11120081 | 0.00000 | 0.479924 | 18.7201 |
| 5 | 11120082 | 0.475403 | 0.00452098 | 18.7854 | 11120088 | -0.00203946 | 0.481963 | 18.6230 |