| Red | Green | Blue | |
| z | 17.64 | ||
| znorm | Inf | ||
| sky | -Inf | -Inf | -Inf |
| S/N | 25.3 | 44.3 | 47.4 |
| S/N(c) | 0.0 | 0.0 | 0.0 |
| SN(E/C) |
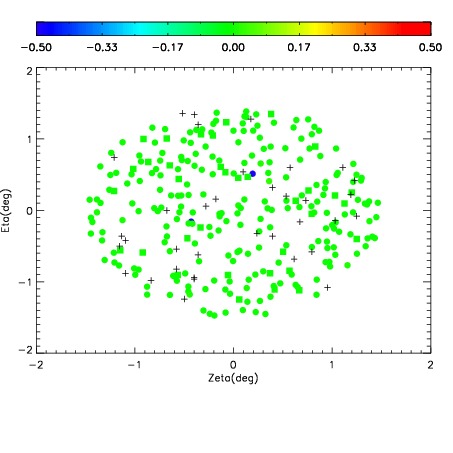
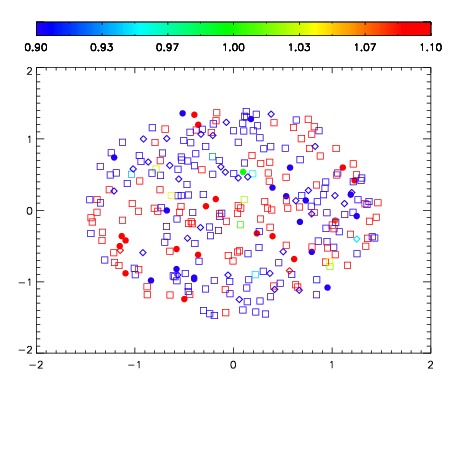
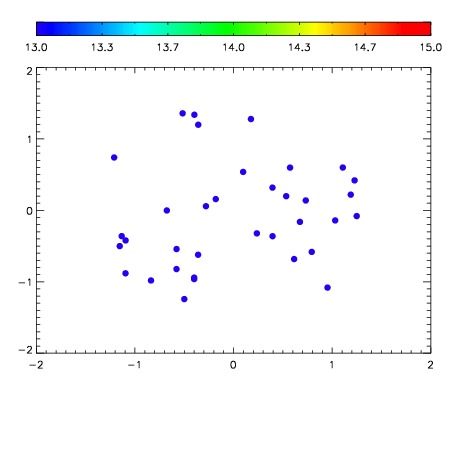

| Frame | Nreads | Zeropoints | Mag plots | Spatial mag deviation | Spatial sky 16325A emission deviations (filled: sky, open: star) | Spatial sky continuum emission | Spatial sky telluric CO2 absorption deviations (filled: H < 10) | |||||||||||||||||||||||
| 0 | 0 |
|
|
|
|
|
|
| IPAIR | NAME | SHIFT | NEWSHIFT | S/N | NAME | SHIFT | NEWSHIFT | S/N |
| 0 | 11440048 | 0.478714 | 0.00000 | 18.9722 | 11440046 | -0.00340395 | 0.482118 | 18.9880 |
| 1 | 11440047 | 0.478040 | 0.000673980 | 18.9442 | 11440049 | -0.00359335 | 0.482307 | 18.9682 |
| 2 | 11440044 | 0.476688 | 0.00202599 | 18.8704 | 11440045 | -0.00292233 | 0.481636 | 18.9527 |
| 3 | 11440043 | 0.476495 | 0.00221899 | 18.8552 | 11440042 | 0.00000 | 0.478714 | 18.8259 |