| Red | Green | Blue | |
| z | 17.64 | ||
| znorm | Inf | ||
| sky | -Inf | -NaN | -Inf |
| S/N | 22.7 | 40.9 | 44.5 |
| S/N(c) | 0.0 | 0.0 | 0.0 |
| SN(E/C) |
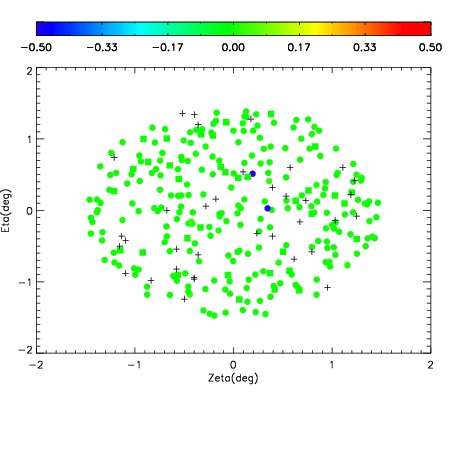
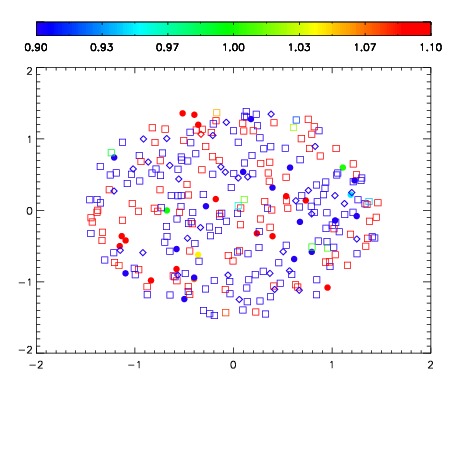
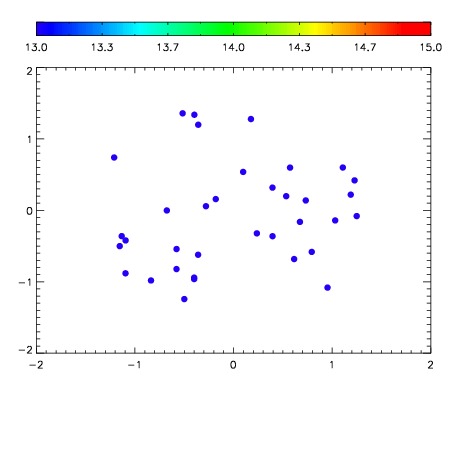

| Frame | Nreads | Zeropoints | Mag plots | Spatial mag deviation | Spatial sky 16325A emission deviations (filled: sky, open: star) | Spatial sky continuum emission | Spatial sky telluric CO2 absorption deviations (filled: H < 10) | |||||||||||||||||||||||
| 0 | 0 |
|
|
|
|
|
|
| IPAIR | NAME | SHIFT | NEWSHIFT | S/N | NAME | SHIFT | NEWSHIFT | S/N |
| 0 | 11640055 | 0.491767 | 0.00000 | 18.8740 | 11640054 | -0.000892213 | 0.492659 | 18.8548 |
| 1 | 11640056 | 0.491494 | 0.000272989 | 18.8118 | 11640057 | -0.00122423 | 0.492991 | 18.8463 |
| 2 | 11640052 | 0.491416 | 0.000350982 | 18.7676 | 11640053 | -0.00146342 | 0.493230 | 18.7980 |
| 3 | 11640051 | 0.491313 | 0.000453979 | 18.7541 | 11640050 | 0.00000 | 0.491767 | 18.6673 |