| Red | Green | Blue | |
| z | 17.64 | ||
| znorm | Inf | ||
| sky | -NaN | -Inf | -Inf |
| S/N | 34.5 | 55.4 | 60.1 |
| S/N(c) | 0.0 | 0.0 | 0.0 |
| SN(E/C) |
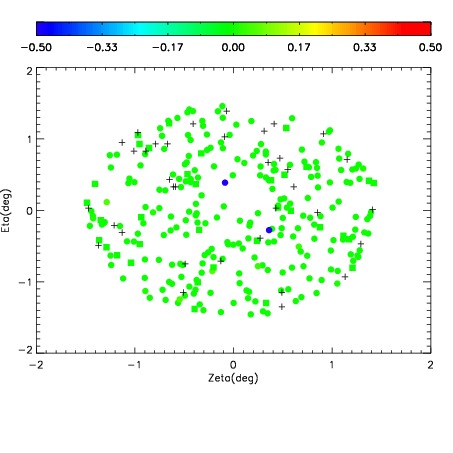
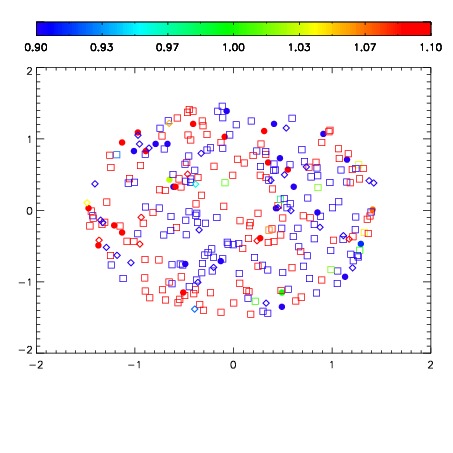
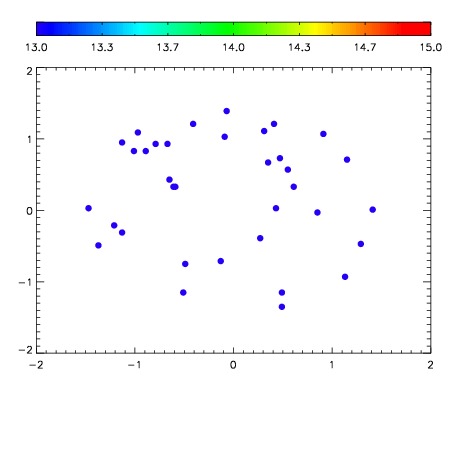

| Frame | Nreads | Zeropoints | Mag plots | Spatial mag deviation | Spatial sky 16325A emission deviations (filled: sky, open: star) | Spatial sky continuum emission | Spatial sky telluric CO2 absorption deviations (filled: H < 10) | |||||||||||||||||||||||
| 0 | 0 |
|
|
|
|
|
|
| IPAIR | NAME | SHIFT | NEWSHIFT | S/N | NAME | SHIFT | NEWSHIFT | S/N |
| 0 | 11140093 | 0.489550 | 0.00000 | 19.1483 | 11140094 | 0.00188898 | 0.487661 | 19.1044 |
| 1 | 11140089 | 0.488551 | 0.000999004 | 19.1547 | 11140090 | 0.00130189 | 0.488248 | 19.1292 |
| 2 | 11140092 | 0.487988 | 0.00156200 | 19.1490 | 11140086 | 0.000712687 | 0.488837 | 19.1139 |
| 3 | 11140088 | 0.488592 | 0.000957996 | 19.0926 | 11140087 | 0.00240542 | 0.487145 | 19.0997 |
| 4 | 11140085 | 0.485396 | 0.00415400 | 19.0398 | 11140091 | 0.00222318 | 0.487327 | 19.0635 |
| 5 | 11140084 | 0.485035 | 0.00451499 | 19.0082 | 11140083 | 0.00000 | 0.489550 | 19.0033 |