| Red | Green | Blue | |
| z | 17.64 | ||
| znorm | Inf | ||
| sky | -Inf | -Inf | -Inf |
| S/N | 24.1 | 40.2 | 44.9 |
| S/N(c) | 0.0 | 0.0 | 0.0 |
| SN(E/C) |
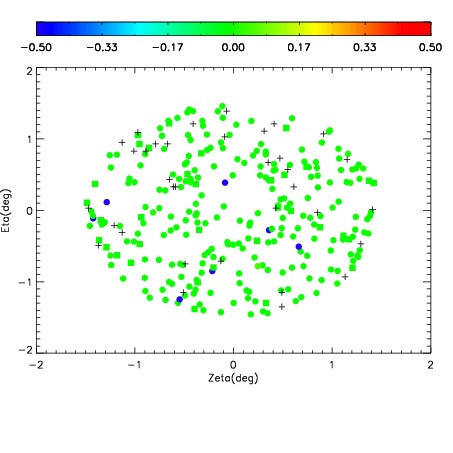
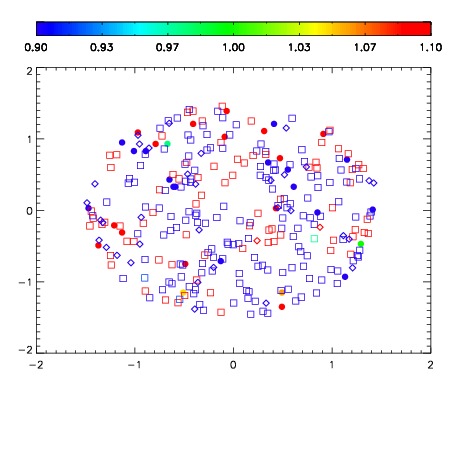
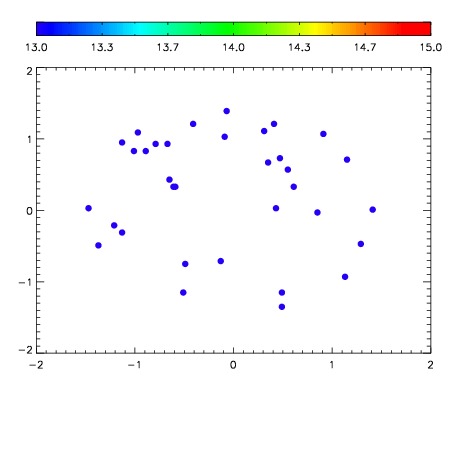

| Frame | Nreads | Zeropoints | Mag plots | Spatial mag deviation | Spatial sky 16325A emission deviations (filled: sky, open: star) | Spatial sky continuum emission | Spatial sky telluric CO2 absorption deviations (filled: H < 10) | |||||||||||||||||||||||
| 0 | 0 |
|
|
|
|
|
|
| IPAIR | NAME | SHIFT | NEWSHIFT | S/N | NAME | SHIFT | NEWSHIFT | S/N |
| 0 | 11650045 | 0.496338 | 0.00000 | 18.8753 | 11650046 | -0.00121375 | 0.497552 | 19.0614 |
| 1 | 11650048 | 0.495158 | 0.00118002 | 19.0748 | 11650047 | 0.000100743 | 0.496237 | 19.0926 |
| 2 | 11650049 | 0.495353 | 0.000984997 | 19.0050 | 11650050 | -0.000846265 | 0.497184 | 19.0815 |
| 3 | 11650044 | 0.496194 | 0.000144005 | 18.7681 | 11650043 | 0.00000 | 0.496338 | 16.5529 |