| Red | Green | Blue | |
| z | 17.64 | ||
| znorm | Inf | ||
| sky | -NaN | -Inf | -Inf |
| S/N | 22.1 | 40.3 | 43.4 |
| S/N(c) | 0.0 | 0.0 | 0.0 |
| SN(E/C) |
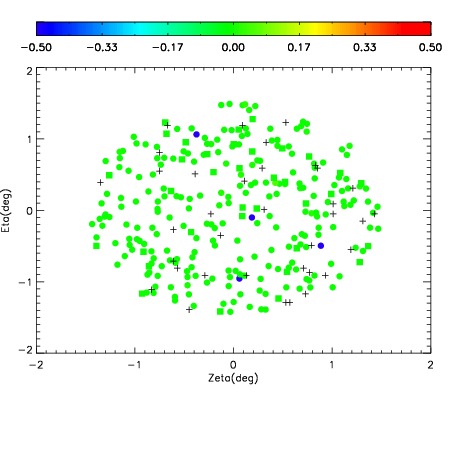
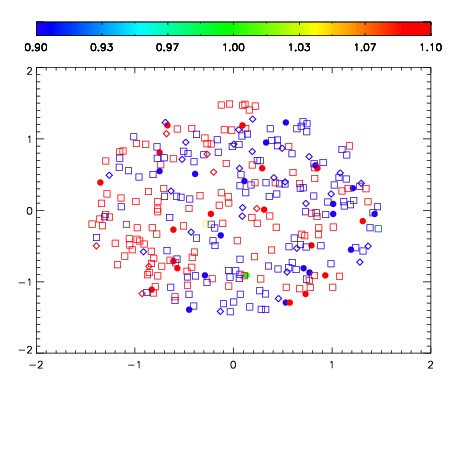
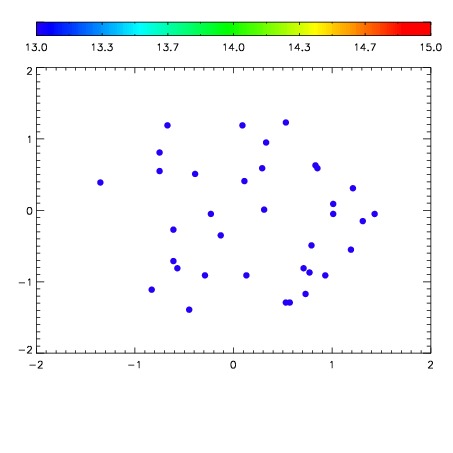

| Frame | Nreads | Zeropoints | Mag plots | Spatial mag deviation | Spatial sky 16325A emission deviations (filled: sky, open: star) | Spatial sky continuum emission | Spatial sky telluric CO2 absorption deviations (filled: H < 10) | |||||||||||||||||||||||
| 0 | 0 |
|
|
|
|
|
|
| IPAIR | NAME | SHIFT | NEWSHIFT | S/N | NAME | SHIFT | NEWSHIFT | S/N |
| 0 | 11150085 | 0.483603 | 0.00000 | 18.5252 | 11150084 | 0.000867378 | 0.482736 | 18.6026 |
| 1 | 11150078 | 0.482405 | 0.00119799 | 18.8022 | 11150076 | 0.00000 | 0.483603 | 18.8821 |
| 2 | 11150077 | 0.481795 | 0.00180799 | 18.7951 | 11150079 | -0.000598094 | 0.484201 | 18.8464 |
| 3 | 11150081 | 0.480868 | 0.00273499 | 18.6877 | 11150080 | -0.000846706 | 0.484450 | 18.7637 |
| 4 | 11150082 | 0.481812 | 0.00179100 | 18.6736 | 11150083 | 0.000545952 | 0.483057 | 18.6598 |