| Red | Green | Blue | |
| z | 17.64 | ||
| znorm | Inf | ||
| sky | -Inf | -Inf | -Inf |
| S/N | 23.2 | 39.8 | 42.2 |
| S/N(c) | 0.0 | 0.0 | 0.0 |
| SN(E/C) |
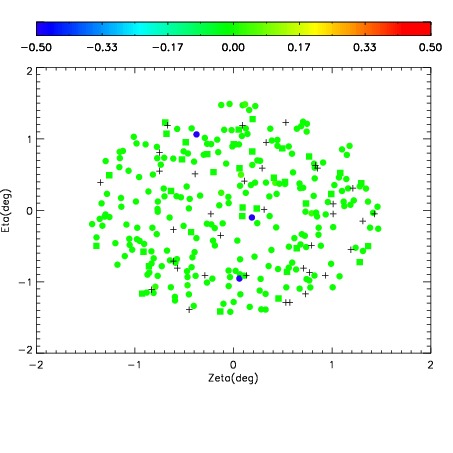
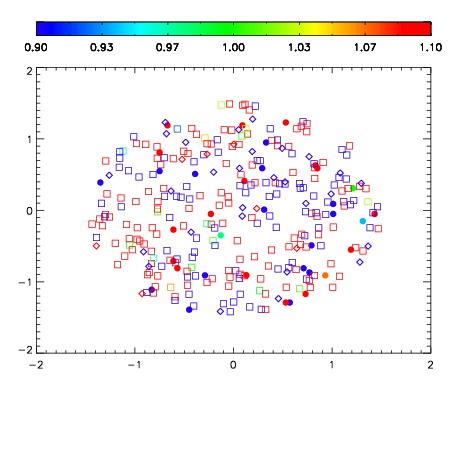
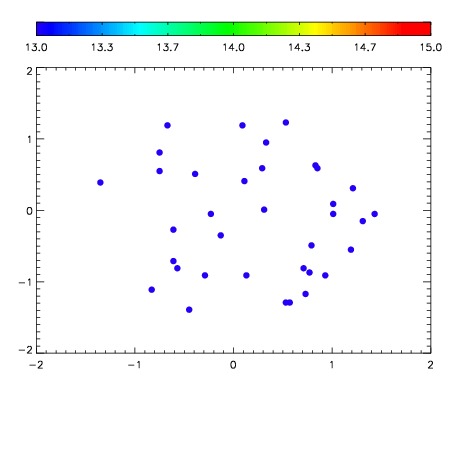

| Frame | Nreads | Zeropoints | Mag plots | Spatial mag deviation | Spatial sky 16325A emission deviations (filled: sky, open: star) | Spatial sky continuum emission | Spatial sky telluric CO2 absorption deviations (filled: H < 10) | |||||||||||||||||||||||
| 0 | 0 |
|
|
|
|
|
|
| IPAIR | NAME | SHIFT | NEWSHIFT | S/N | NAME | SHIFT | NEWSHIFT | S/N |
| 0 | 11410073 | 0.479037 | 0.00000 | 19.0081 | 11410074 | -0.000564533 | 0.479602 | 18.9924 |
| 1 | 11410072 | 0.478488 | 0.000548989 | 18.9416 | 11410070 | -0.00249268 | 0.481530 | 18.8897 |
| 2 | 11410069 | 0.477493 | 0.00154400 | 18.8227 | 11410071 | -0.00224035 | 0.481277 | 18.8690 |
| 3 | 11410068 | 0.477395 | 0.00164199 | 18.3788 | 11410067 | 0.00000 | 0.479037 | 18.8600 |