| Red | Green | Blue | |
| z | 17.64 | ||
| znorm | Inf | ||
| sky | -Inf | -Inf | -Inf |
| S/N | 23.8 | 41.8 | 44.9 |
| S/N(c) | 0.0 | 0.0 | 0.0 |
| SN(E/C) |
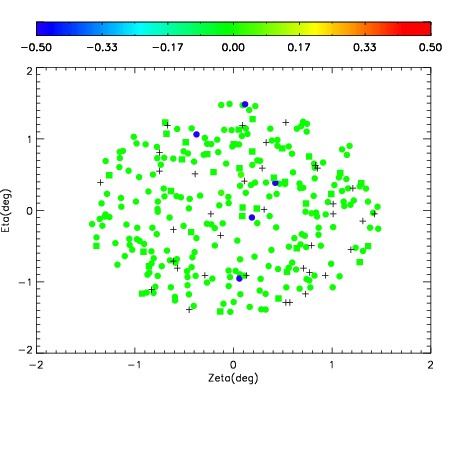
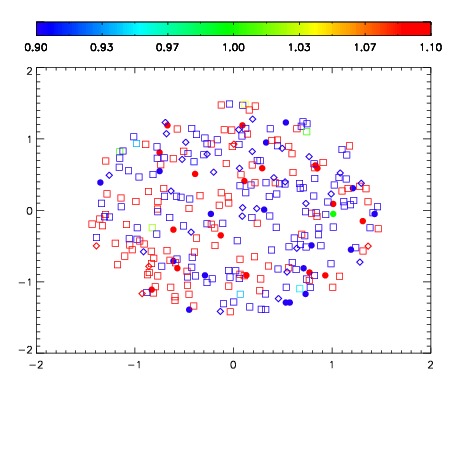
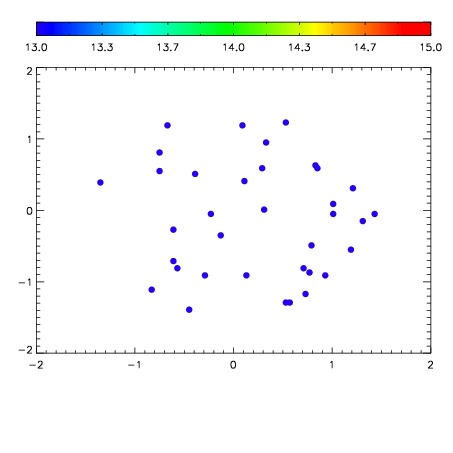

| Frame | Nreads | Zeropoints | Mag plots | Spatial mag deviation | Spatial sky 16325A emission deviations (filled: sky, open: star) | Spatial sky continuum emission | Spatial sky telluric CO2 absorption deviations (filled: H < 10) | |||||||||||||||||||||||
| 0 | 0 |
|
|
|
|
|
|
| IPAIR | NAME | SHIFT | NEWSHIFT | S/N | NAME | SHIFT | NEWSHIFT | S/N |
| 0 | 11670068 | 0.486625 | 0.00000 | 18.7655 | 11670069 | -0.00363835 | 0.490263 | 18.8606 |
| 1 | 11670064 | 0.486519 | 0.000105977 | 18.9768 | 11670065 | -0.00412172 | 0.490747 | 18.9639 |
| 2 | 11670063 | 0.485448 | 0.00117698 | 18.9714 | 11670066 | -0.00320030 | 0.489825 | 18.8929 |
| 3 | 11670067 | 0.485508 | 0.00111699 | 18.8517 | 11670062 | 0.00000 | 0.486625 | 18.8781 |