| Red | Green | Blue | |
| z | 17.64 | ||
| znorm | Inf | ||
| sky | -Inf | -Inf | -Inf |
| S/N | 22.5 | 39.4 | 43.1 |
| S/N(c) | 0.0 | 0.0 | 0.0 |
| SN(E/C) |
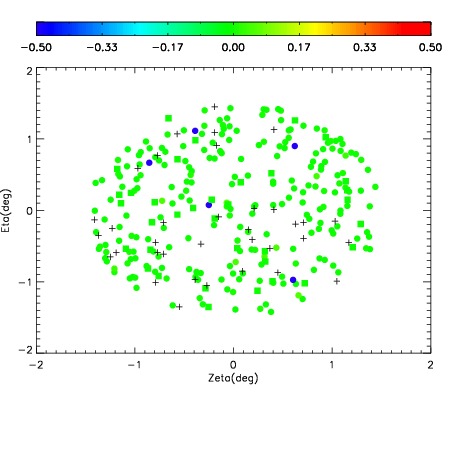

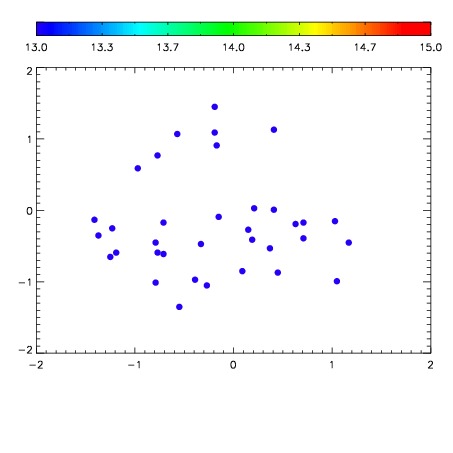

| Frame | Nreads | Zeropoints | Mag plots | Spatial mag deviation | Spatial sky 16325A emission deviations (filled: sky, open: star) | Spatial sky continuum emission | Spatial sky telluric CO2 absorption deviations (filled: H < 10) | |||||||||||||||||||||||
| 0 | 0 |
|
|
|
|
|
|
| IPAIR | NAME | SHIFT | NEWSHIFT | S/N | NAME | SHIFT | NEWSHIFT | S/N |
| 0 | 11390083 | 0.475508 | 0.00000 | 18.6091 | 11390084 | 0.000480485 | 0.475028 | 18.5244 |
| 1 | 11390079 | 0.473577 | 0.00193101 | 18.8644 | 11390077 | 0.00000 | 0.475508 | 18.8580 |
| 2 | 11390078 | 0.472805 | 0.00270301 | 18.7960 | 11390080 | -0.00238975 | 0.477898 | 18.8180 |
| 3 | 11390082 | 0.474416 | 0.00109202 | 18.7412 | 11390081 | -0.00250670 | 0.478015 | 18.7088 |