| Red | Green | Blue | |
| z | 17.64 | ||
| znorm | Inf | ||
| sky | -NaN | -NaN | -Inf |
| S/N | 27.3 | 47.9 | 51.6 |
| S/N(c) | 0.0 | 0.0 | 0.0 |
| SN(E/C) |
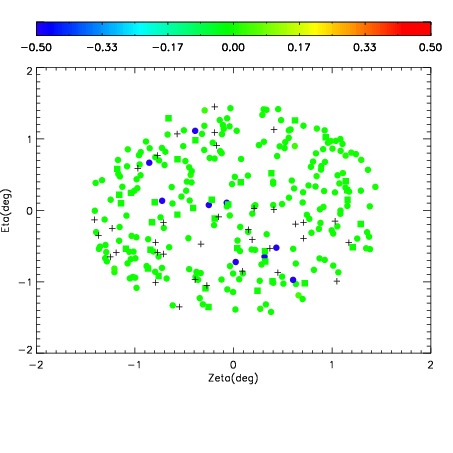
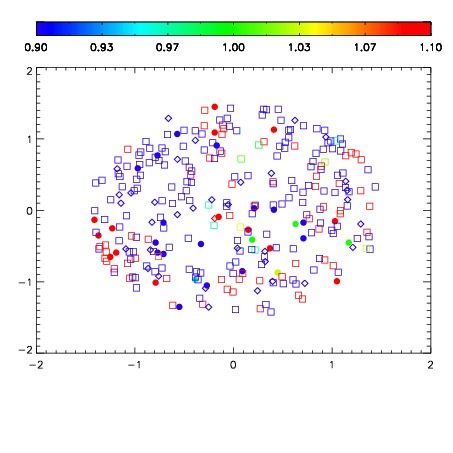
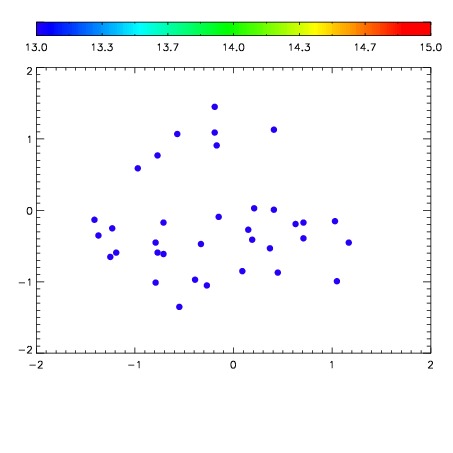

| Frame | Nreads | Zeropoints | Mag plots | Spatial mag deviation | Spatial sky 16325A emission deviations (filled: sky, open: star) | Spatial sky continuum emission | Spatial sky telluric CO2 absorption deviations (filled: H < 10) | |||||||||||||||||||||||
| 0 | 0 |
|
|
|
|
|
|
| IPAIR | NAME | SHIFT | NEWSHIFT | S/N | NAME | SHIFT | NEWSHIFT | S/N |
| 0 | 11650055 | 0.493785 | 0.00000 | 19.0018 | 11650058 | -0.00209025 | 0.495875 | 19.0025 |
| 1 | 11650056 | 0.493479 | 0.000305980 | 19.0384 | 11650057 | -0.00186157 | 0.495647 | 19.0339 |
| 2 | 11650059 | 0.491671 | 0.00211400 | 19.0079 | 11650061 | -0.00304040 | 0.496825 | 19.0077 |
| 3 | 11650060 | 0.492320 | 0.00146499 | 18.9941 | 11650054 | 0.00000 | 0.493785 | 18.9475 |