| Red | Green | Blue | |
| z | 17.64 | ||
| znorm | Inf | ||
| sky | -Inf | -Inf | -Inf |
| S/N | 16.5 | 28.8 | 31.0 |
| S/N(c) | 0.0 | 0.0 | 0.0 |
| SN(E/C) |

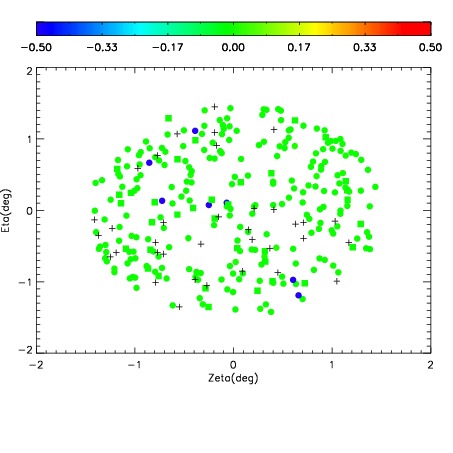
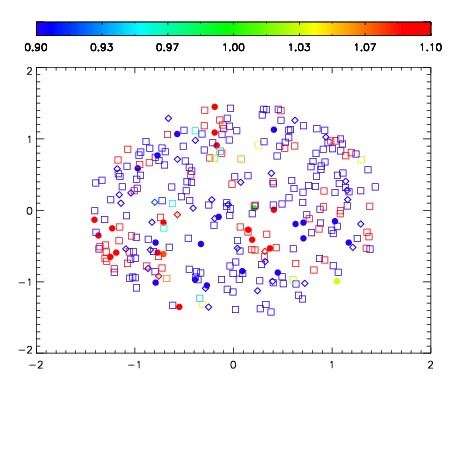


| Frame | Nreads | Zeropoints | Mag plots | Spatial mag deviation | Spatial sky 16325A emission deviations (filled: sky, open: star) | Spatial sky continuum emission | Spatial sky telluric CO2 absorption deviations (filled: H < 10) | |||||||||||||||||||||||
| 0 | 0 |
|
|
|
|
|
|
| IPAIR | NAME | SHIFT | NEWSHIFT | S/N | NAME | SHIFT | NEWSHIFT | S/N |
| 0 | 11730061 | 0.492855 | 0.00000 | 18.4862 | 11730055 | 0.00000 | 0.492855 | 18.1600 |
| 1 | 11730060 | 0.492828 | 2.70009e-05 | 18.7163 | 11730062 | 0.000355653 | 0.492499 | 18.6517 |
| 2 | 11730057 | 0.490218 | 0.00263700 | 18.6128 | 11730059 | -0.000592687 | 0.493448 | 18.5435 |
| 3 | 11730056 | 0.490851 | 0.00200400 | 18.2809 | 11730058 | -5.43799e-06 | 0.492860 | 17.8501 |