| Red | Green | Blue | |
| z | 17.64 | ||
| znorm | Inf | ||
| sky | -Inf | -Inf | -Inf |
| S/N | 17.5 | 29.8 | 33.6 |
| S/N(c) | 0.0 | 0.0 | 0.0 |
| SN(E/C) |
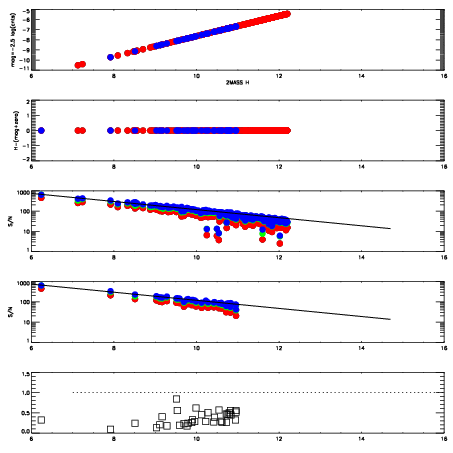
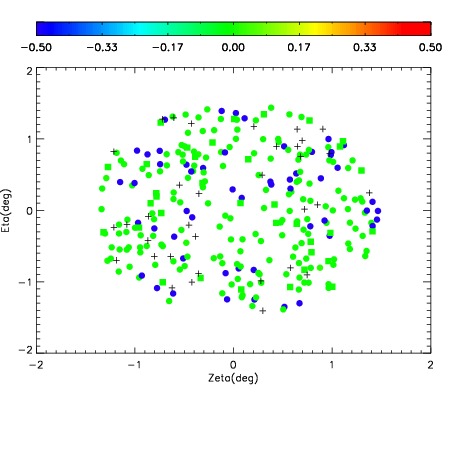
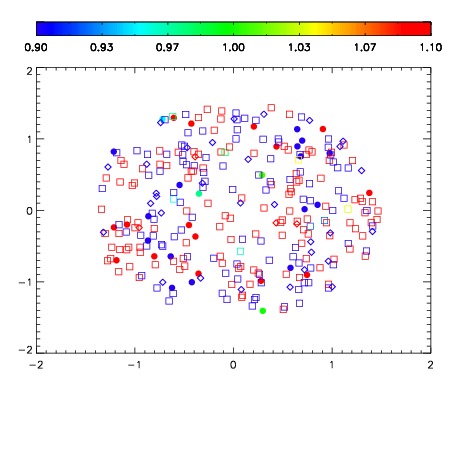
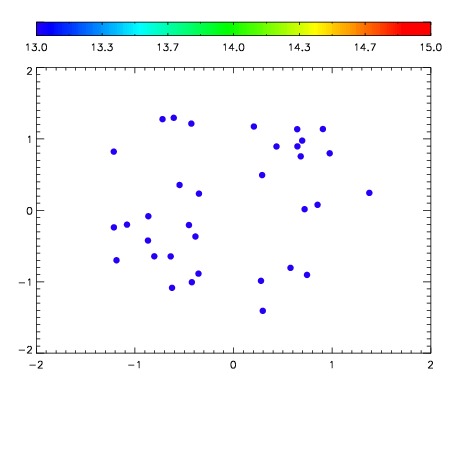

| Frame | Nreads | Zeropoints | Mag plots | Spatial mag deviation | Spatial sky 16325A emission deviations (filled: sky, open: star) | Spatial sky continuum emission | Spatial sky telluric CO2 absorption deviations (filled: H < 10) | |||||||||||||||||||||||
| 0 | 0 |
|
|
|
|
|
|
| IPAIR | NAME | SHIFT | NEWSHIFT | S/N | NAME | SHIFT | NEWSHIFT | S/N |
| 0 | 11390061 | 0.473249 | 0.00000 | 18.0767 | 11390062 | -0.00127714 | 0.474526 | 18.4099 |
| 1 | 11390056 | 0.471572 | 0.00167698 | 18.5453 | 11390055 | 0.00000 | 0.473249 | 18.5780 |
| 2 | 11390057 | 0.472123 | 0.00112599 | 18.4482 | 11390059 | 0.000594866 | 0.472654 | 18.5131 |
| 3 | 11390060 | 0.472433 | 0.000815988 | 18.4238 | 11390058 | -0.000461387 | 0.473710 | 18.5018 |