| Red | Green | Blue | |
| z | 17.64 | ||
| znorm | Inf | ||
| sky | -NaN | -NaN | -NaN |
| S/N | 23.7 | 39.0 | 42.1 |
| S/N(c) | 0.0 | 0.0 | 0.0 |
| SN(E/C) |
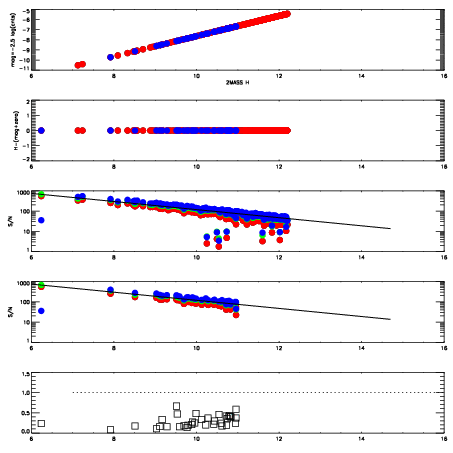
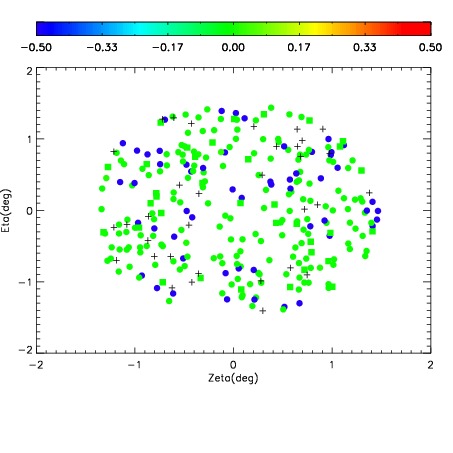
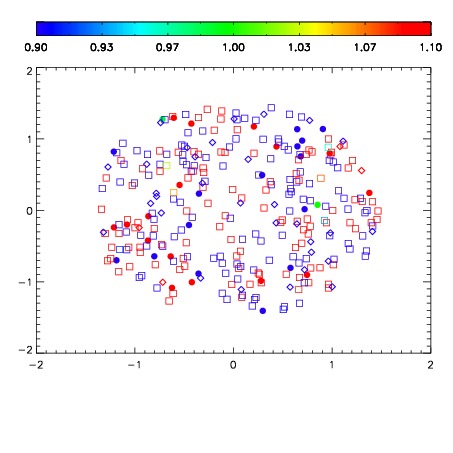
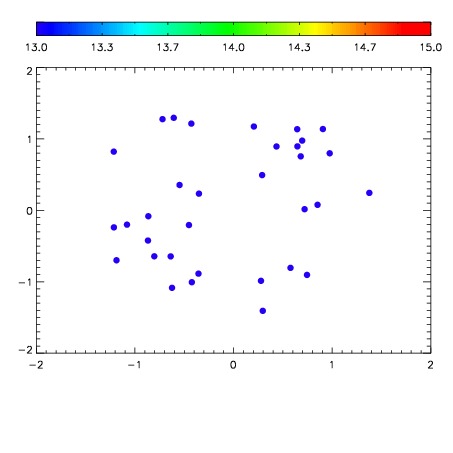

| Frame | Nreads | Zeropoints | Mag plots | Spatial mag deviation | Spatial sky 16325A emission deviations (filled: sky, open: star) | Spatial sky continuum emission | Spatial sky telluric CO2 absorption deviations (filled: H < 10) | |||||||||||||||||||||||
| 0 | 0 |
|
|
|
|
|
|
| IPAIR | NAME | SHIFT | NEWSHIFT | S/N | NAME | SHIFT | NEWSHIFT | S/N |
| 0 | 11450035 | 0.473014 | 0.00000 | 18.9396 | 11450037 | -0.00251537 | 0.475529 | 18.8917 |
| 1 | 11450038 | 0.471276 | 0.00173801 | 19.0359 | 11450036 | -0.00213079 | 0.475145 | 18.9769 |
| 2 | 11450034 | 0.472243 | 0.000770986 | 18.9645 | 11450040 | -0.00336865 | 0.476383 | 18.9662 |
| 3 | 11450039 | 0.472043 | 0.000970989 | 18.8618 | 11450033 | 0.00000 | 0.473014 | 18.6782 |