| Red | Green | Blue | |
| z | 17.64 | ||
| znorm | Inf | ||
| sky | -Inf | -Inf | -Inf |
| S/N | 10.8 | 20.7 | 21.5 |
| S/N(c) | 0.0 | 0.0 | 0.0 |
| SN(E/C) |
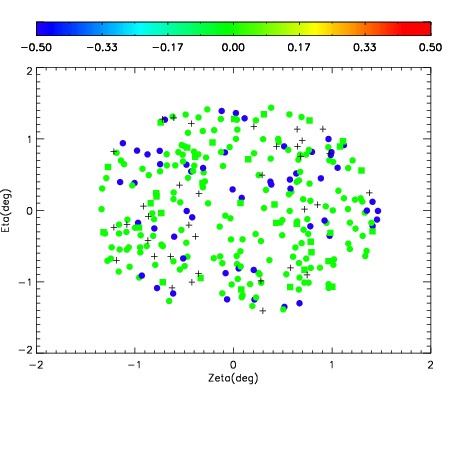
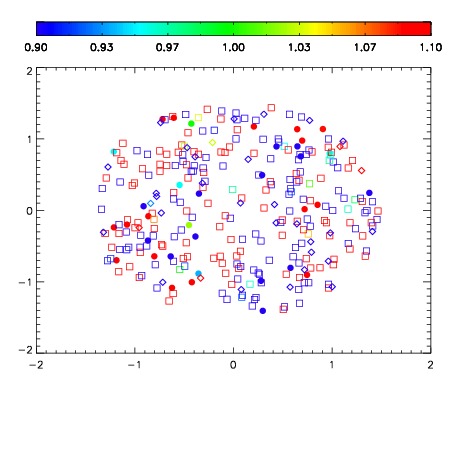
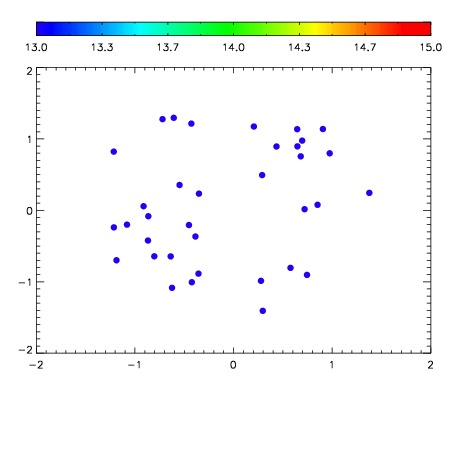

| Frame | Nreads | Zeropoints | Mag plots | Spatial mag deviation | Spatial sky 16325A emission deviations (filled: sky, open: star) | Spatial sky continuum emission | Spatial sky telluric CO2 absorption deviations (filled: H < 10) | |||||||||||||||||||||||
| 0 | 0 |
|
|
|
|
|
|
| IPAIR | NAME | SHIFT | NEWSHIFT | S/N | NAME | SHIFT | NEWSHIFT | S/N |
| 0 | 11720038 | 0.492899 | 0.00000 | 18.2731 | 11720037 | 0.00000 | 0.492899 | 18.4068 |
| 1 | 11720039 | 0.492805 | 9.39965e-05 | 18.2298 | 11720040 | -0.00349806 | 0.496397 | 18.2408 |