| Red | Green | Blue | |
| z | 17.64 | ||
| znorm | Inf | ||
| sky | -Inf | -NaN | -Inf |
| S/N | 25.9 | 41.5 | 47.0 |
| S/N(c) | 0.0 | 0.0 | 0.0 |
| SN(E/C) |
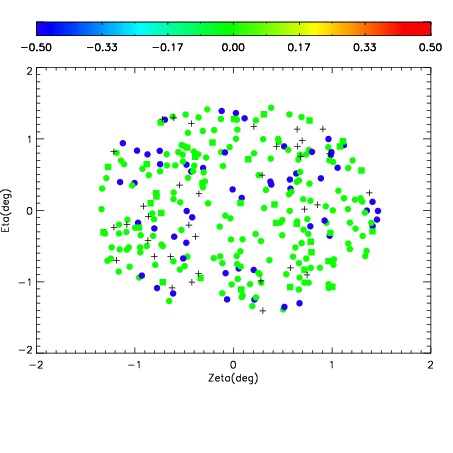
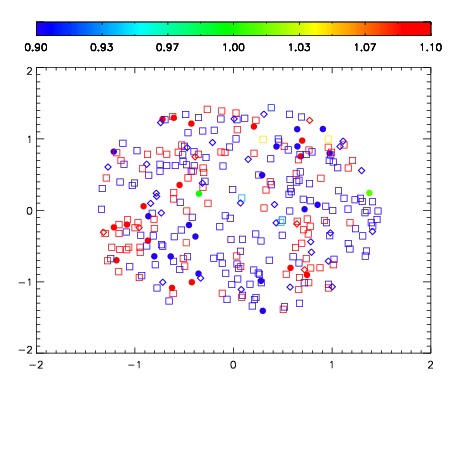
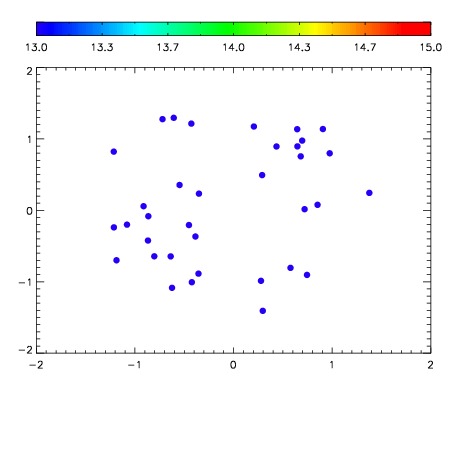

| Frame | Nreads | Zeropoints | Mag plots | Spatial mag deviation | Spatial sky 16325A emission deviations (filled: sky, open: star) | Spatial sky continuum emission | Spatial sky telluric CO2 absorption deviations (filled: H < 10) | |||||||||||||||||||||||
| 0 | 0 |
|
|
|
|
|
|
| IPAIR | NAME | SHIFT | NEWSHIFT | S/N | NAME | SHIFT | NEWSHIFT | S/N |
| 0 | 11950023 | 0.503618 | 0.00000 | 18.8225 | 11950024 | -0.000122087 | 0.503740 | 18.8923 |
| 1 | 11950027 | 0.503082 | 0.000536025 | 19.1406 | 11950028 | 0.000743266 | 0.502875 | 19.1075 |
| 2 | 11950026 | 0.502563 | 0.00105500 | 19.0600 | 11950021 | 0.00000 | 0.503618 | 19.1020 |
| 3 | 11950022 | 0.502840 | 0.000778019 | 19.0529 | 11950025 | -0.000209255 | 0.503827 | 19.0173 |