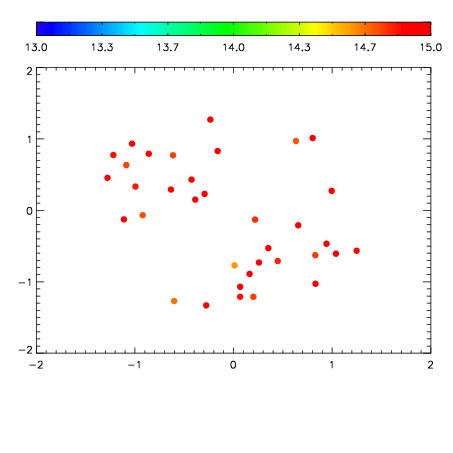
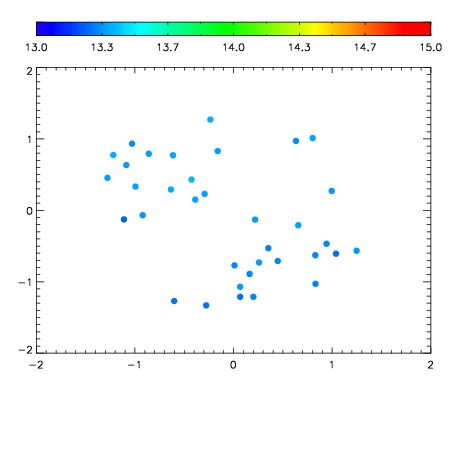
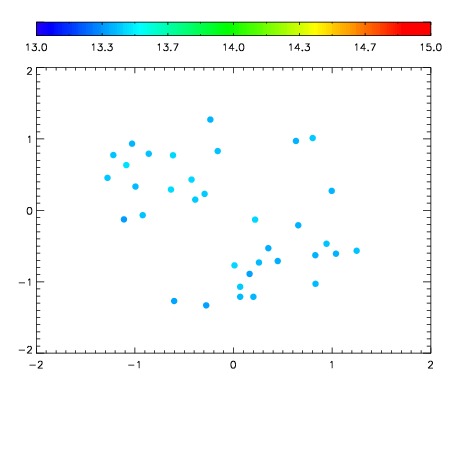
| Frame | Nreads | Zeropoints | Mag plots
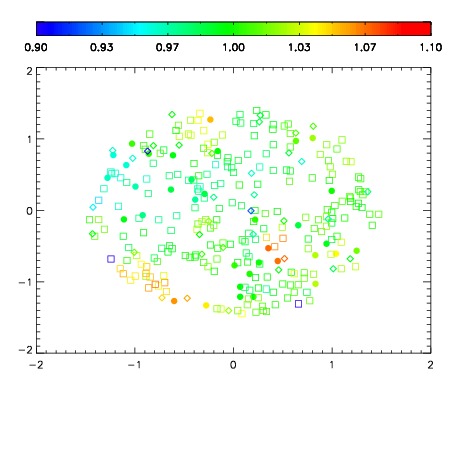
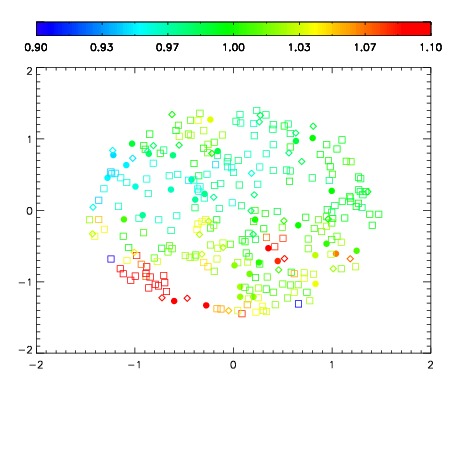
| Spatial mag deviation
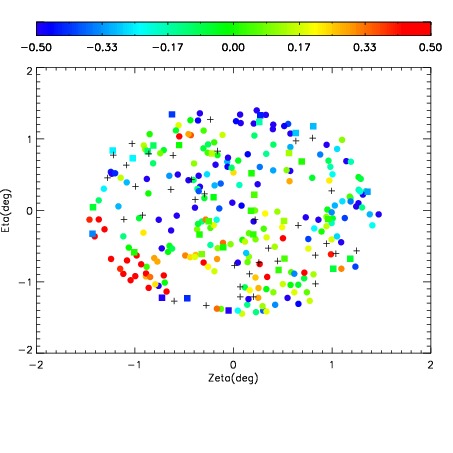
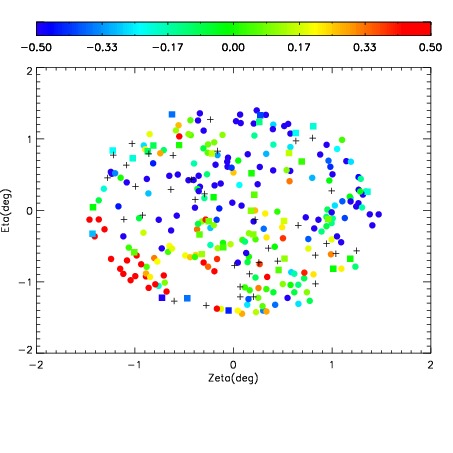
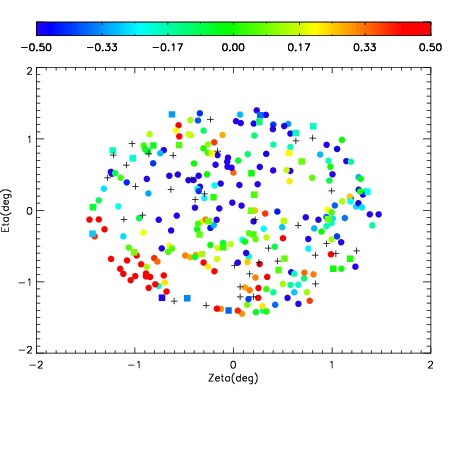
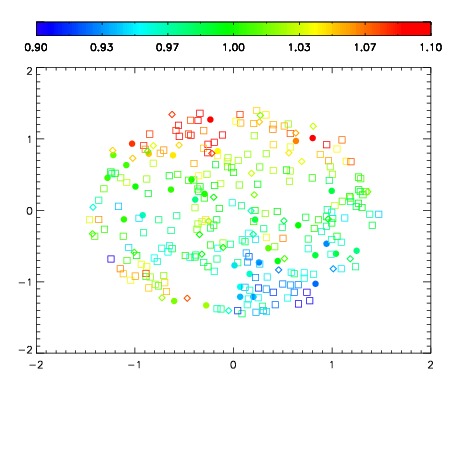
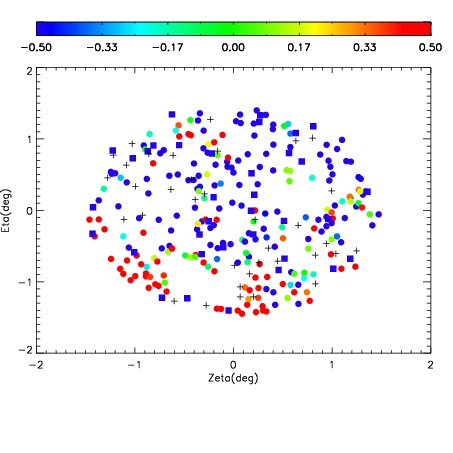
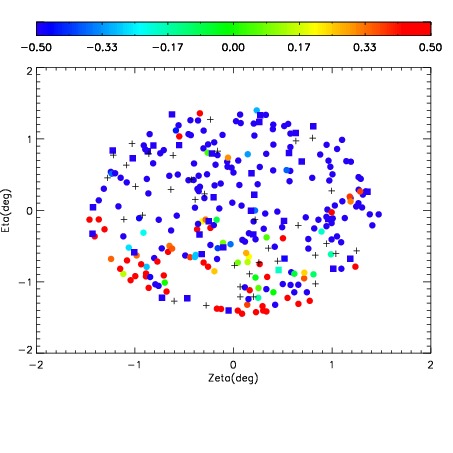
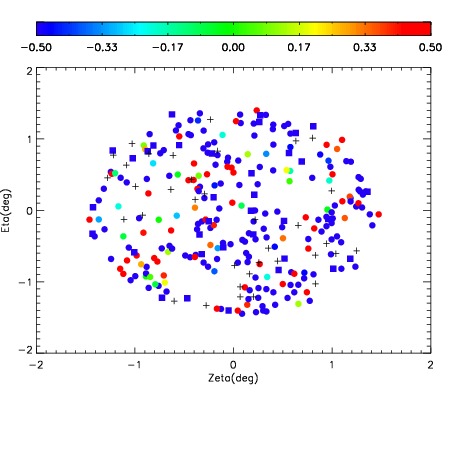
| Spatial sky 16325A emission deviations (filled: sky, open: star)
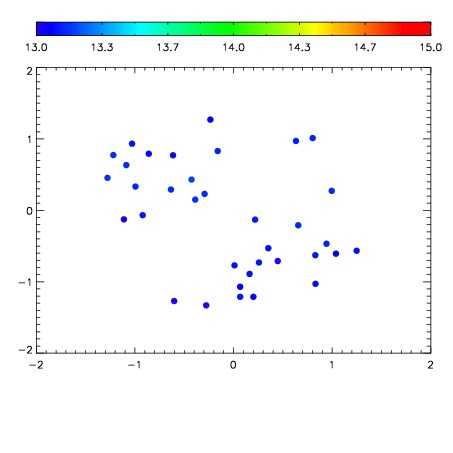
| Spatial sky continuum emission
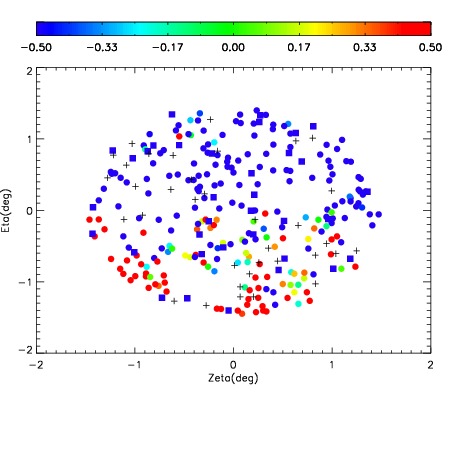
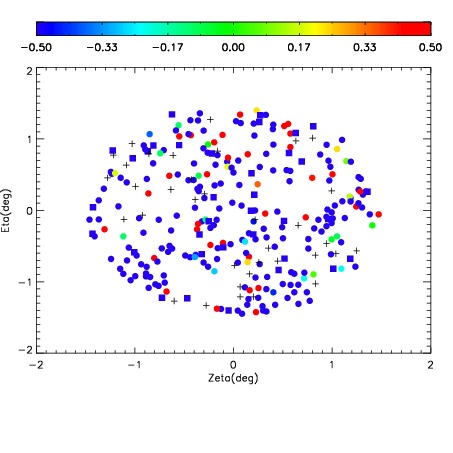
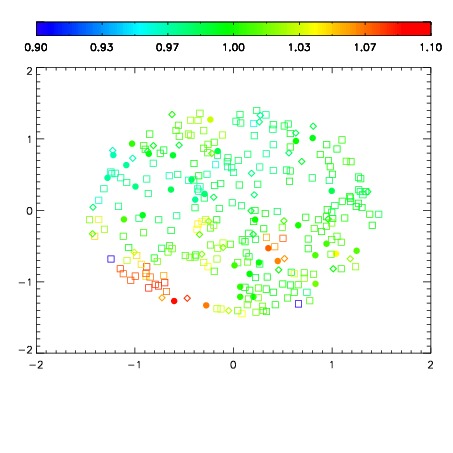
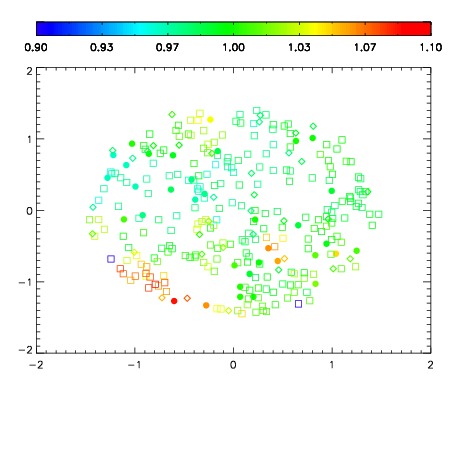
| Spatial sky telluric CO2 absorption deviations (filled: H < 10)
|
| 11970055
| 47
| | Red | Green | Blue
| | z | | 16.79
| | znorm | | 12.61
| | sky | 13.2 | 13.1 | 13.2
| | S/N | 2.3 | 4.3 | 5.2
| | S/N(c) | 7.3 | 4.5 | 13.5
| | SN(E/C) 0.81
|
| 
| 
| 
| 
| 
|
| 11970056
| 47
| | Red | Green | Blue
| | z | | 16.29
| | znorm | | 12.11
| | sky | 13.1 | 13.1 | 13.3
| | S/N | 1.3 | 2.5 | 3.5
| | S/N(c) | 4.8 | 3.2 | 10.5
| | SN(E/C) 0.90
|
| 
| 
| 
| 
| 
|
| 11970057
| 47
| | Red | Green | Blue
| | z | | 16.01
| | znorm | | 11.83
| | sky | 13.2 | 13.1 | 13.4
| | S/N | 1.0 | 1.8 | 3.0
| | S/N(c) | 3.7 | 2.5 | 9.1
| | SN(E/C) 0.92
|
| 
| 
| 
| 
| 
|
| 11970058
| 47
| | Red | Green | Blue
| | z | | 14.92
| | znorm | | 10.74
| | sky | 13.3 | 13.4 | 13.7
| | S/N | 0.2 | 0.3 | 0.2
| | S/N(c) | 0.6 | 0.5 | 2.8
| | SN(E/C) 1.05
|
| 
| 
| 
| 
| 
|
| 11970059
| 47
| | Red | Green | Blue
| | z | | 14.34
| | znorm | | 10.16
| | sky | 15.3 | 14.9 | 15.9
| | S/N | -0.1 | 0.1 | -0.0
| | S/N(c) | 0.0 | 0.0 | 0.0
| | SN(E/C) 5.80
|
| 
| 
| 
| 
| 
|
| 11970060
| 47
| | Red | Green | Blue
| | z | | 14.68
| | znorm | | 10.50
| | sky | 13.3 | 13.3 | 13.6
| | S/N | 0.2 | 0.2 | 0.1
| | S/N(c) | 0.6 | 0.4 | 2.0
| | SN(E/C) 1.05
|
| 
| 
| 
| 
| 
|
| 11970061
| 47
| | Red | Green | Blue
| | z | | 14.32
| | znorm | | 10.14
| | sky | 13.4 | 13.4 | 13.7
| | S/N | -0.0 | 0.1 | -0.2
| | S/N(c) | 0.5 | 0.3 | 1.8
| | SN(E/C) 1.05
|
| 
| 
| 
| 
| 
|
| 11970062
| 47
| | Red | Green | Blue
| | z | | 14.27
| | znorm | | 10.09
| | sky | 15.4 | 15.8 | 15.5
| | S/N | 0.3 | 0.0 | 0.3
| | S/N(c) | 0.0 | 0.1 | 0.0
| | SN(E/C) 4.02
|
| 
| 
| 
| 
| 
|