| Red | Green | Blue | |
| z | 17.64 | ||
| znorm | Inf | ||
| sky | -Inf | -Inf | -Inf |
| S/N | 1.9 | 3.7 | 4.9 |
| S/N(c) | 5.4 | 3.7 | 11.8 |
| SN(E/C) |
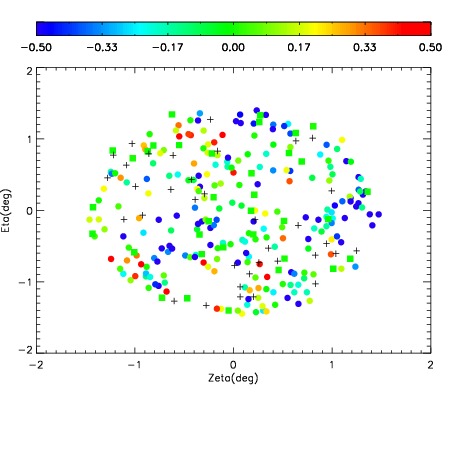
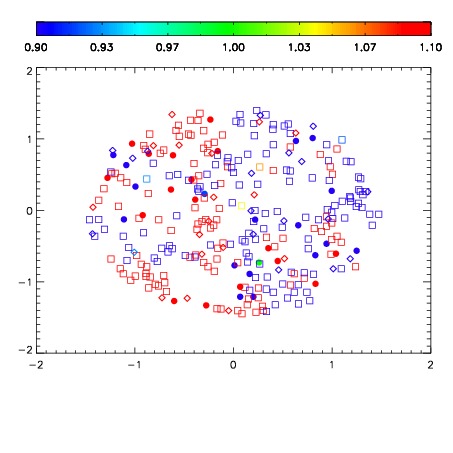
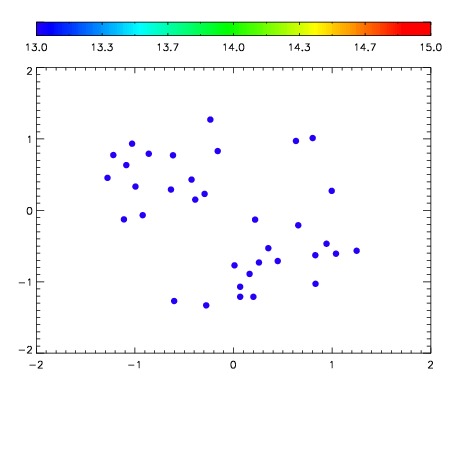

| Frame | Nreads | Zeropoints | Mag plots | Spatial mag deviation | Spatial sky 16325A emission deviations (filled: sky, open: star) | Spatial sky continuum emission | Spatial sky telluric CO2 absorption deviations (filled: H < 10) | |||||||||||||||||||||||
| 0 | 0 |
|
|
|
|
|
|
| IPAIR | NAME | SHIFT | NEWSHIFT | S/N | NAME | SHIFT | NEWSHIFT | S/N |
| 0 | 11970057 | 0.504434 | 0.00000 | 15.9735 | 11970058 | -0.000967867 | 0.505402 | 14.4047 |
| 1 | 11970056 | 0.503659 | 0.000774980 | 16.2350 | 11970055 | 0.00000 | 0.504434 | 16.7175 |
| 2 | 11970061 | 0.503297 | 0.00113702 | 13.8706 | 11970060 | -0.00144829 | 0.505882 | 14.1798 |