| Red | Green | Blue | |
| z | 17.64 | ||
| znorm | Inf | ||
| sky | -Inf | -Inf | -Inf |
| S/N | 24.1 | 42.2 | 44.7 |
| S/N(c) | 62.4 | 39.7 | 43.5 |
| SN(E/C) |
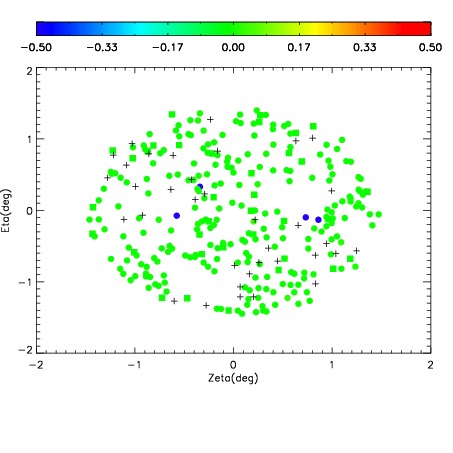
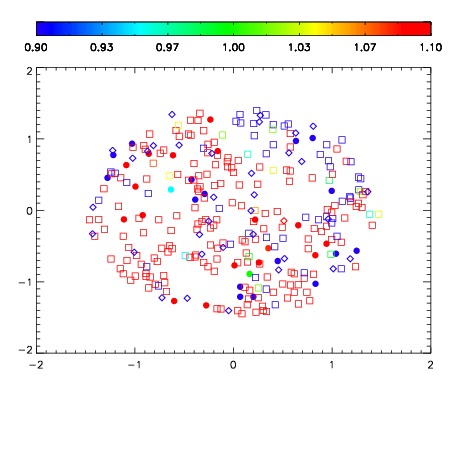
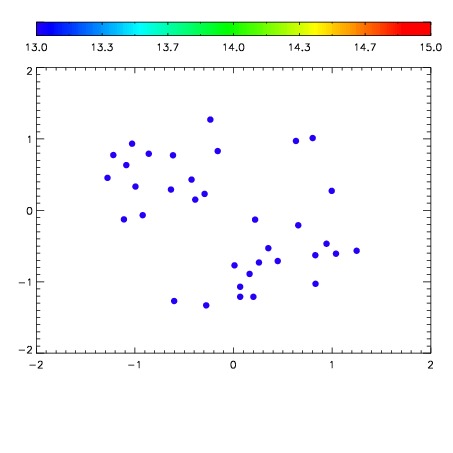

| Frame | Nreads | Zeropoints | Mag plots | Spatial mag deviation | Spatial sky 16325A emission deviations (filled: sky, open: star) | Spatial sky continuum emission | Spatial sky telluric CO2 absorption deviations (filled: H < 10) | |||||||||||||||||||||||
| 0 | 0 |
|
|
|
|
|
|
| IPAIR | NAME | SHIFT | NEWSHIFT | S/N | NAME | SHIFT | NEWSHIFT | S/N |
| 0 | 12070071 | 0.505405 | 0.00000 | 18.9408 | 12070070 | 0.00557432 | 0.499831 | 18.9114 |
| 1 | 12070072 | 0.504996 | 0.000409007 | 18.9474 | 12070073 | 0.0104367 | 0.494968 | 18.9524 |
| 2 | 12070068 | 0.502715 | 0.00269002 | 18.8506 | 12070066 | 0.00000 | 0.505405 | 18.9017 |
| 3 | 12070067 | 0.502270 | 0.00313503 | 18.8476 | 12070069 | 0.00622711 | 0.499178 | 18.8647 |