| Red | Green | Blue | |
| z | 17.64 | ||
| znorm | Inf | ||
| sky | -Inf | -NaN | -Inf |
| S/N | 11.6 | 23.1 | 23.9 |
| S/N(c) | 10.3 | 46.6 | 55.3 |
| SN(E/C) |
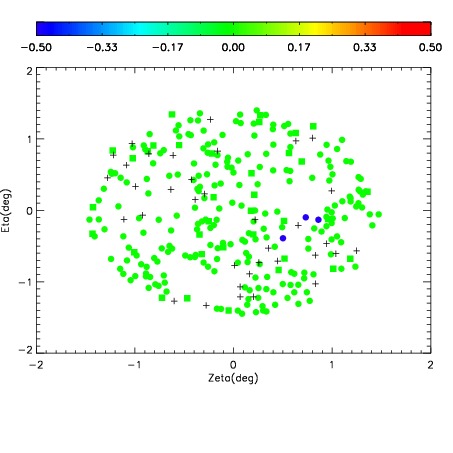
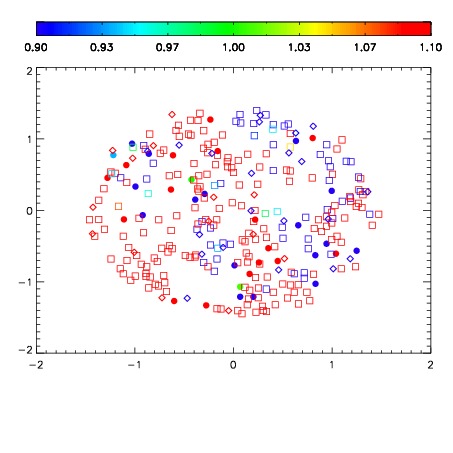
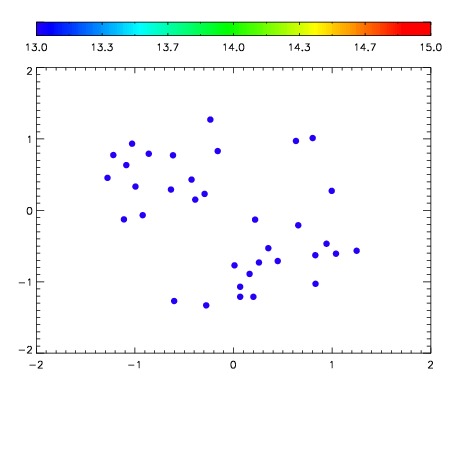

| Frame | Nreads | Zeropoints | Mag plots | Spatial mag deviation | Spatial sky 16325A emission deviations (filled: sky, open: star) | Spatial sky continuum emission | Spatial sky telluric CO2 absorption deviations (filled: H < 10) | |||||||||||||||||||||||
| 0 | 0 |
|
|
|
|
|
|
| IPAIR | NAME | SHIFT | NEWSHIFT | S/N | NAME | SHIFT | NEWSHIFT | S/N |
| 0 | 12290030 | 0.497159 | 0.00000 | 17.9828 | 12290028 | -0.000142348 | 0.497301 | 18.0246 |
| 1 | 12290026 | 0.495359 | 0.00180000 | 17.9138 | 12290031 | 0.000924579 | 0.496234 | 18.0169 |
| 2 | 12290029 | 0.496733 | 0.000425994 | 17.8208 | 12290024 | 0.00000 | 0.497159 | 17.9204 |
| 3 | 12290025 | 0.495581 | 0.00157800 | 17.8122 | 12290027 | -0.000618390 | 0.497777 | 17.8061 |