| Red | Green | Blue | |
| z | 17.64 | ||
| znorm | Inf | ||
| sky | -Inf | -NaN | -NaN |
| S/N | 8.8 | 17.8 | 18.9 |
| S/N(c) | 20.3 | 40.4 | 28.7 |
| SN(E/C) |
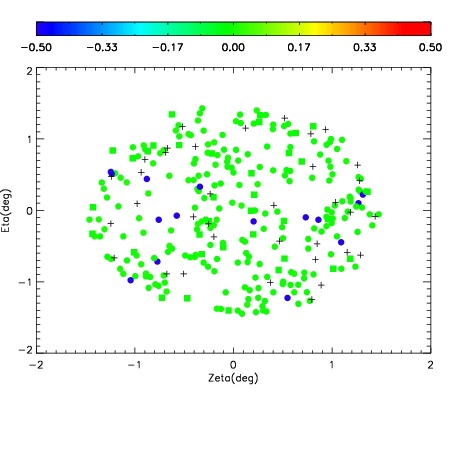
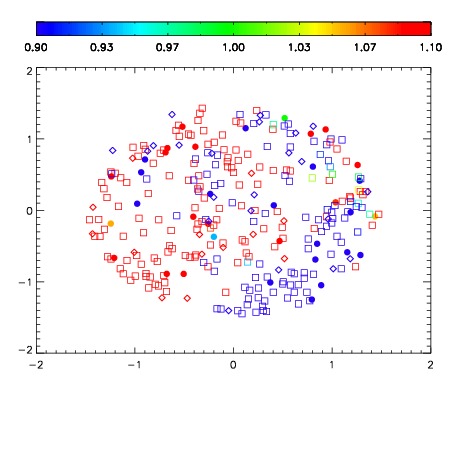
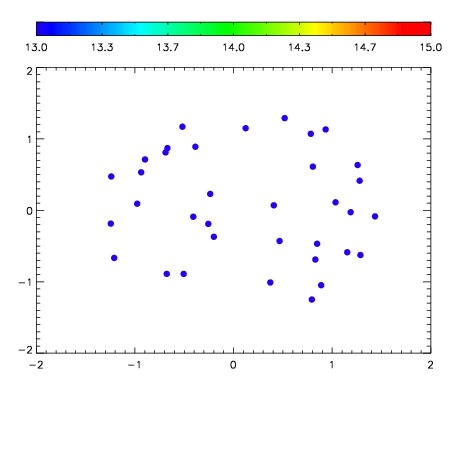

| Frame | Nreads | Zeropoints | Mag plots | Spatial mag deviation | Spatial sky 16325A emission deviations (filled: sky, open: star) | Spatial sky continuum emission | Spatial sky telluric CO2 absorption deviations (filled: H < 10) | |||||||||||||||||||||||
| 0 | 0 |
|
|
|
|
|
|
| IPAIR | NAME | SHIFT | NEWSHIFT | S/N | NAME | SHIFT | NEWSHIFT | S/N |
| 0 | 12260039 | 0.490415 | 0.00000 | 17.3872 | 12260040 | -0.00211734 | 0.492532 | 17.3332 |
| 1 | 12260034 | 0.489191 | 0.00122401 | 17.4151 | 12260033 | 0.00000 | 0.490415 | 17.4468 |
| 2 | 12260038 | 0.489351 | 0.00106400 | 17.4044 | 12260036 | -0.00408493 | 0.494500 | 17.4332 |
| 3 | 12260035 | 0.489581 | 0.000834018 | 17.4043 | 12260037 | -0.00310201 | 0.493517 | 17.3639 |