| Red | Green | Blue | |
| z | 17.64 | ||
| znorm | Inf | ||
| sky | -Inf | -NaN | -NaN |
| S/N | 21.0 | 36.9 | 38.4 |
| S/N(c) | 44.4 | 49.6 | 86.4 |
| SN(E/C) |

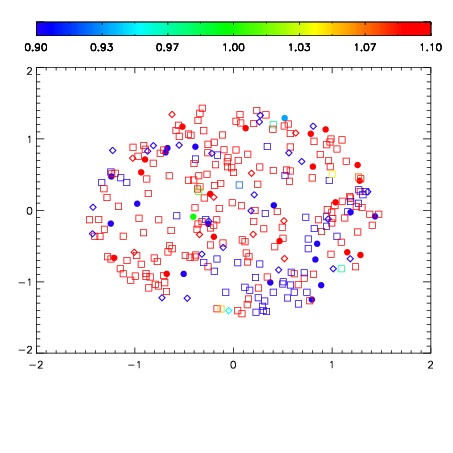


| Frame | Nreads | Zeropoints | Mag plots | Spatial mag deviation | Spatial sky 16325A emission deviations (filled: sky, open: star) | Spatial sky continuum emission | Spatial sky telluric CO2 absorption deviations (filled: H < 10) | |||||||||||||||||||||||
| 0 | 0 |
|
|
|
|
|
|
| IPAIR | NAME | SHIFT | NEWSHIFT | S/N | NAME | SHIFT | NEWSHIFT | S/N |
| 0 | 12320023 | 0.488668 | 0.00000 | 18.8748 | 12320025 | -0.00535552 | 0.494024 | 18.9029 |
| 1 | 12320024 | 0.488593 | 7.49826e-05 | 18.9109 | 12320022 | 0.00000 | 0.488668 | 18.9252 |
| 2 | 12320027 | 0.487045 | 0.00162300 | 18.0724 | 12320026 | -0.00540802 | 0.494076 | 18.8064 |
| 3 | 12320028 | 0.487323 | 0.00134501 | 18.0578 | 12320029 | -0.00438733 | 0.493055 | 18.2385 |