| Red | Green | Blue | |
| z | 17.64 | ||
| znorm | Inf | ||
| sky | -Inf | -NaN | -Inf |
| S/N | 12.6 | 21.9 | 23.8 |
| S/N(c) | 26.9 | 31.1 | 52.1 |
| SN(E/C) |


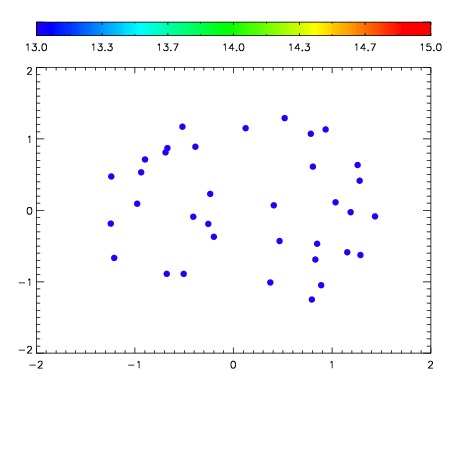

| Frame | Nreads | Zeropoints | Mag plots | Spatial mag deviation | Spatial sky 16325A emission deviations (filled: sky, open: star) | Spatial sky continuum emission | Spatial sky telluric CO2 absorption deviations (filled: H < 10) | |||||||||||||||||||||||
| 0 | 0 |
|
|
|
|
|
|
| IPAIR | NAME | SHIFT | NEWSHIFT | S/N | NAME | SHIFT | NEWSHIFT | S/N |
| 0 | 12490015 | 0.492365 | 0.00000 | 18.0913 | 12490016 | -0.00200056 | 0.494366 | 18.1961 |
| 1 | 12490014 | 0.491967 | 0.000398010 | 18.5478 | 12490013 | 0.00000 | 0.492365 | 18.4566 |