| Red | Green | Blue | |
| z | 17.63 | ||
| znorm | Inf | ||
| sky | -NaN | -NaN | -Inf |
| S/N | 27.6 | 44.8 | 48.7 |
| S/N(c) | 55.3 | 95.4 | 63.3 |
| SN(E/C) |
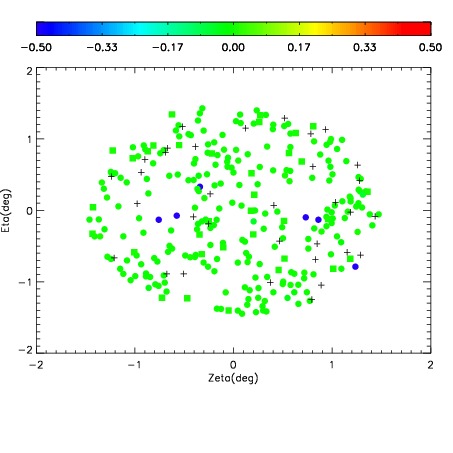
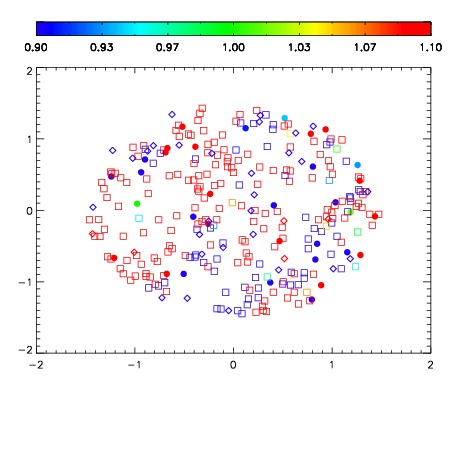
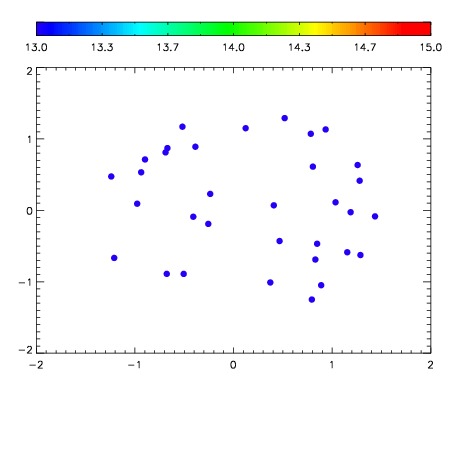

| Frame | Nreads | Zeropoints | Mag plots | Spatial mag deviation | Spatial sky 16325A emission deviations (filled: sky, open: star) | Spatial sky continuum emission | Spatial sky telluric CO2 absorption deviations (filled: H < 10) | |||||||||||||||||||||||
| 0 | 0 |
|
|
|
|
|
|
| IPAIR | NAME | SHIFT | NEWSHIFT | S/N | NAME | SHIFT | NEWSHIFT | S/N |
| 0 | 12760019 | 0.487697 | 0.00000 | 19.0173 | 12760020 | -0.00229391 | 0.489991 | 19.0465 |
| 1 | 12760022 | 0.486342 | 0.00135499 | 19.0808 | 12760024 | 0.000371981 | 0.487325 | 19.0584 |
| 2 | 12760023 | 0.486896 | 0.000800997 | 19.0785 | 12760021 | -0.00134027 | 0.489037 | 19.0514 |
| 3 | 12760018 | 0.487541 | 0.000156015 | 18.9977 | 12760017 | 0.00000 | 0.487697 | 18.9545 |