| Red | Green | Blue | |
| z | 17.63 | ||
| znorm | Inf | ||
| sky | -NaN | -NaN | -NaN |
| S/N | 28.8 | 49.9 | 52.0 |
| S/N(c) | 22.2 | 33.1 | 40.8 |
| SN(E/C) |
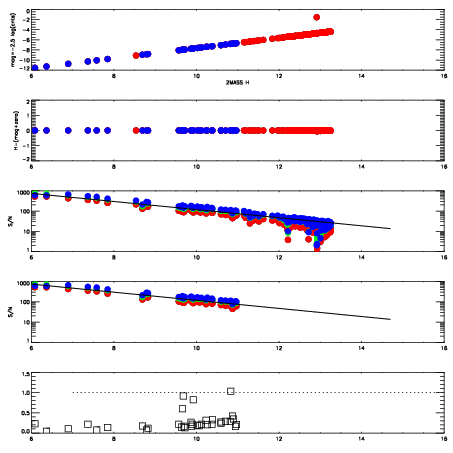
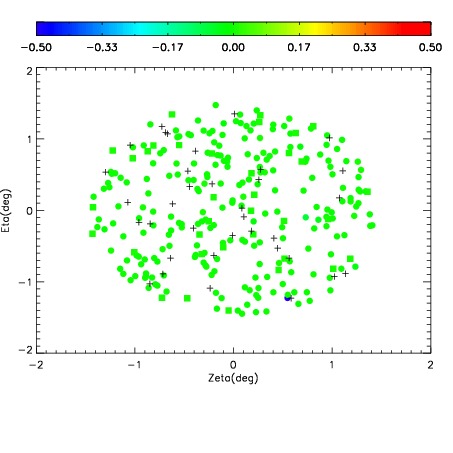
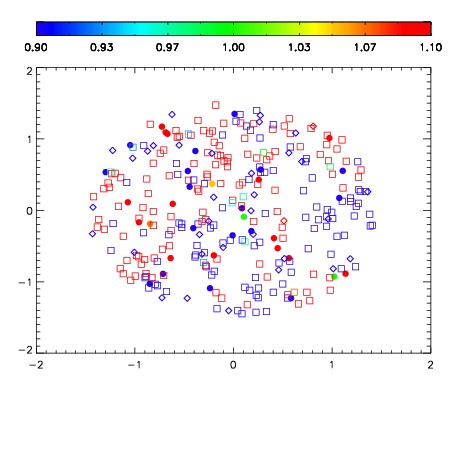


| Frame | Nreads | Zeropoints | Mag plots | Spatial mag deviation | Spatial sky 16325A emission deviations (filled: sky, open: star) | Spatial sky continuum emission | Spatial sky telluric CO2 absorption deviations (filled: H < 10) | |||||||||||||||||||||||
| 0 | 0 |
|
|
|
|
|
|
| IPAIR | NAME | SHIFT | NEWSHIFT | S/N | NAME | SHIFT | NEWSHIFT | S/N |
| 0 | 12250038 | 0.489859 | 0.00000 | 19.0098 | 12250041 | -0.00867867 | 0.498538 | 19.0153 |
| 1 | 12250039 | 0.489509 | 0.000350028 | 19.0099 | 12250037 | 0.00000 | 0.489859 | 19.0224 |
| 2 | 12250042 | 0.486389 | 0.00347000 | 18.9994 | 12250040 | -0.00899284 | 0.498852 | 19.0050 |
| 3 | 12250043 | 0.487088 | 0.00277102 | 18.9562 | 12250044 | -0.00781027 | 0.497669 | 19.0015 |