| Red | Green | Blue | |
| z | 17.64 | ||
| znorm | Inf | ||
| sky | -NaN | -Inf | -NaN |
| S/N | 28.2 | 48.7 | 52.0 |
| S/N(c) | 20.4 | 36.7 | 38.2 |
| SN(E/C) |
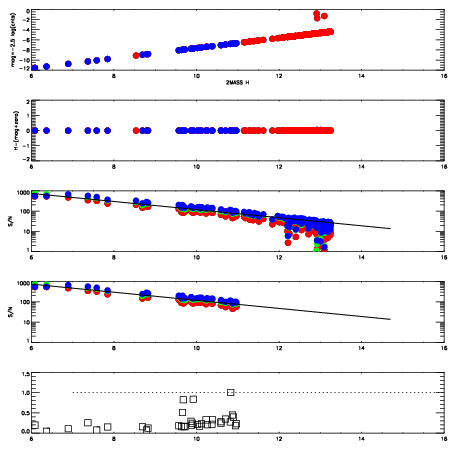


| Frame | Nreads | Zeropoints | Mag plots | Spatial mag deviation | Spatial sky 16325A emission deviations (filled: sky, open: star) | Spatial sky continuum emission | Spatial sky telluric CO2 absorption deviations (filled: H < 10) | |||||||||||||||||||||||
| 0 | 0 |
|
|
|
|
|
|
| IPAIR | NAME | SHIFT | NEWSHIFT | S/N | NAME | SHIFT | NEWSHIFT | S/N |
| 0 | 12310035 | 0.497914 | 0.00000 | 19.0869 | 12310036 | 0.00248667 | 0.495427 | 19.0000 |
| 1 | 12310034 | 0.497303 | 0.000610977 | 19.1041 | 12310033 | 0.00000 | 0.497914 | 19.0781 |
| 2 | 12310039 | 0.495621 | 0.00229299 | 18.8875 | 12310040 | 0.00135249 | 0.496561 | 18.9452 |
| 3 | 12310038 | 0.495505 | 0.00240898 | 18.8491 | 12310037 | 0.00239666 | 0.495517 | 18.8974 |