| Red | Green | Blue | |
| z | 17.64 | ||
| znorm | Inf | ||
| sky | -Inf | -NaN | -NaN |
| S/N | 29.0 | 49.3 | 52.7 |
| S/N(c) | 22.0 | 32.8 | 40.4 |
| SN(E/C) |


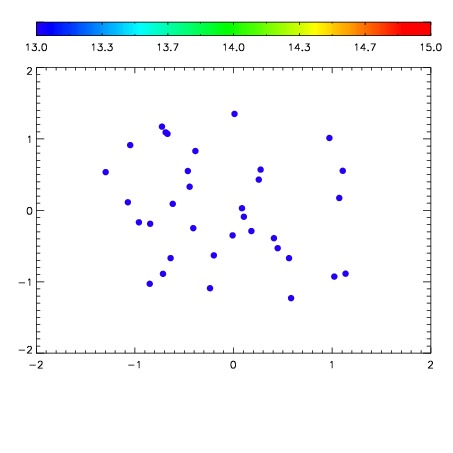

| Frame | Nreads | Zeropoints | Mag plots | Spatial mag deviation | Spatial sky 16325A emission deviations (filled: sky, open: star) | Spatial sky continuum emission | Spatial sky telluric CO2 absorption deviations (filled: H < 10) | |||||||||||||||||||||||
| 0 | 0 |
|
|
|
|
|
|
| IPAIR | NAME | SHIFT | NEWSHIFT | S/N | NAME | SHIFT | NEWSHIFT | S/N |
| 0 | 12550028 | 0.493900 | 0.00000 | 19.0918 | 12550026 | 0.00000 | 0.493900 | 19.0673 |
| 1 | 12550032 | 0.492134 | 0.00176600 | 19.1327 | 12550029 | -0.00104364 | 0.494944 | 19.0888 |
| 2 | 12550031 | 0.491972 | 0.00192800 | 19.0995 | 12550030 | -0.000989030 | 0.494889 | 19.0866 |
| 3 | 12550027 | 0.493666 | 0.000234008 | 19.0984 | 12550033 | -0.000879615 | 0.494780 | 19.0767 |