| Red | Green | Blue | |
| z | 17.64 | ||
| znorm | Inf | ||
| sky | -NaN | -NaN | -Inf |
| S/N | 26.3 | 40.7 | 42.4 |
| S/N(c) | 25.0 | 56.4 | 112.8 |
| SN(E/C) |
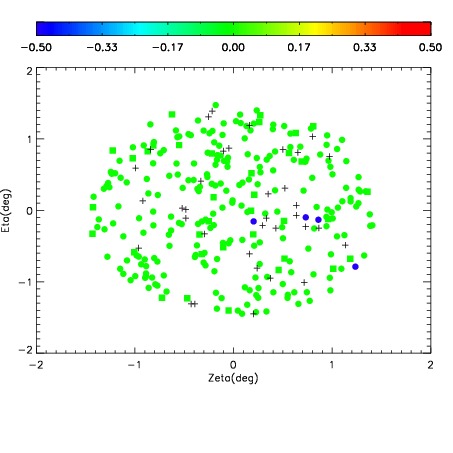
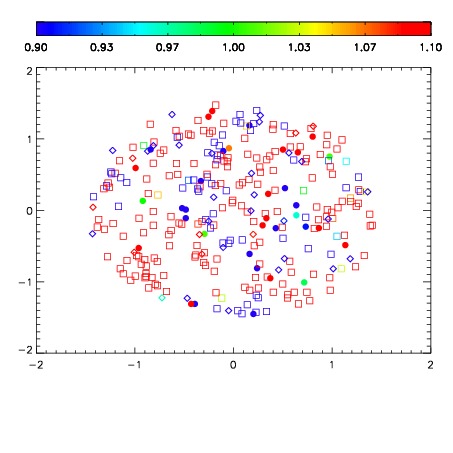
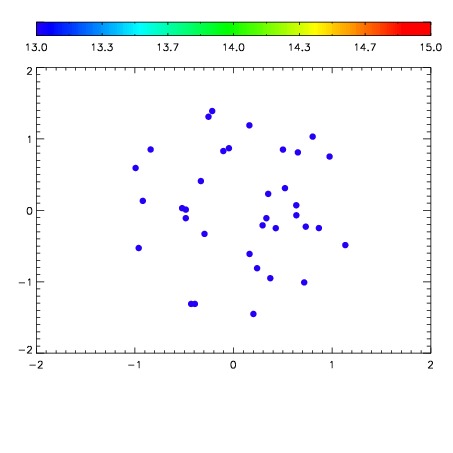

| Frame | Nreads | Zeropoints | Mag plots | Spatial mag deviation | Spatial sky 16325A emission deviations (filled: sky, open: star) | Spatial sky continuum emission | Spatial sky telluric CO2 absorption deviations (filled: H < 10) | |||||||||||||||||||||||
| 0 | 0 |
|
|
|
|
|
|
| IPAIR | NAME | SHIFT | NEWSHIFT | S/N | NAME | SHIFT | NEWSHIFT | S/N |
| 0 | 12300012 | 0.494363 | 0.00000 | 18.8996 | 12300018 | -0.00133760 | 0.495701 | 18.8289 |
| 1 | 12300013 | 0.494276 | 8.70228e-05 | 18.9524 | 12300014 | -0.00195410 | 0.496317 | 19.0163 |
| 2 | 12300016 | 0.493847 | 0.000515997 | 18.9276 | 12300015 | -0.00224239 | 0.496605 | 18.9858 |
| 3 | 12300017 | 0.494003 | 0.000360012 | 18.8672 | 12300011 | 0.00000 | 0.494363 | 18.8271 |