| Red | Green | Blue | |
| z | 17.64 | ||
| znorm | Inf | ||
| sky | -Inf | -NaN | -Inf |
| S/N | 22.9 | 42.0 | 43.3 |
| S/N(c) | 17.4 | 31.0 | 6.7 |
| SN(E/C) |
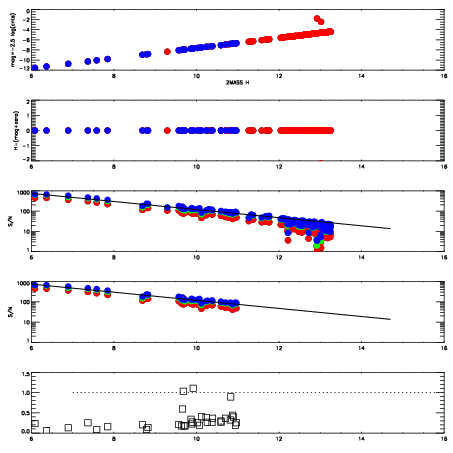
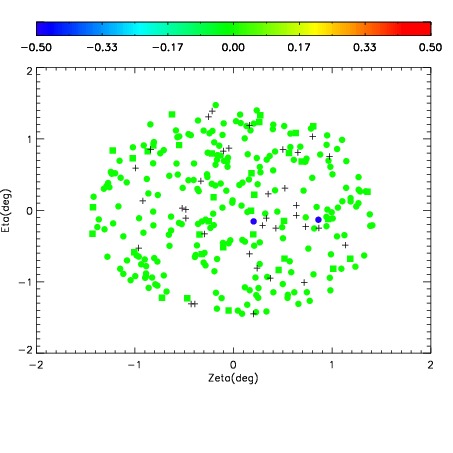
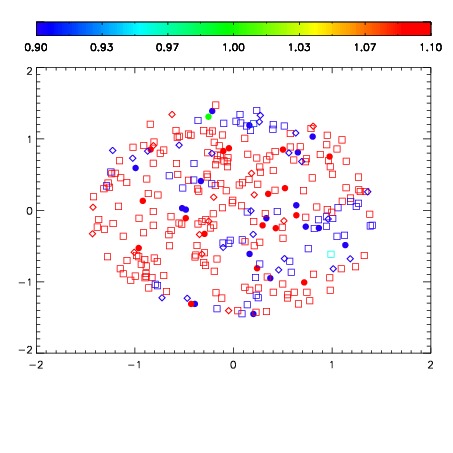


| Frame | Nreads | Zeropoints | Mag plots | Spatial mag deviation | Spatial sky 16325A emission deviations (filled: sky, open: star) | Spatial sky continuum emission | Spatial sky telluric CO2 absorption deviations (filled: H < 10) | |||||||||||||||||||||||
| 0 | 0 |
|
|
|
|
|
|
| IPAIR | NAME | SHIFT | NEWSHIFT | S/N | NAME | SHIFT | NEWSHIFT | S/N |
| 0 | 12540031 | 0.490703 | 0.00000 | 18.6804 | 12540033 | 0.000510324 | 0.490193 | 18.5801 |
| 1 | 12540027 | 0.489872 | 0.000830978 | 18.7481 | 12540026 | 0.00000 | 0.490703 | 19.0008 |
| 2 | 12540028 | 0.489689 | 0.00101399 | 18.6557 | 12540030 | 7.96900e-05 | 0.490623 | 18.5778 |
| 3 | 12540032 | 0.490346 | 0.000356972 | 18.5642 | 12540029 | 0.000621855 | 0.490081 | 18.3884 |